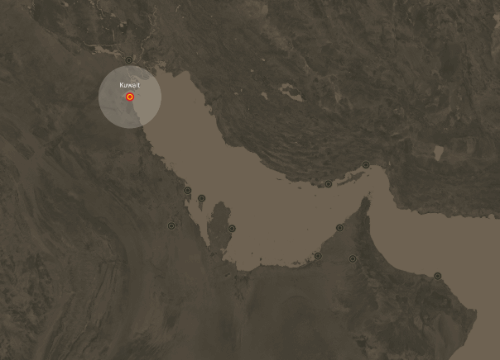
oa Kuwait City
الوصول إلى النص الكامل
Chapter
- المؤلفون: Prof. Spiro N. Pollalis and Nader Ardalan
- المصدر: Gulf Sustainable Urbanism – Past, Volume II , الصفحات 174-255
- تاريخ النشر: ديسمبر ٢٠١٨
- DOI: https://doi.org/10.5339/GSU.9789927118968_3

Full text loading...
/deliver/fulltext/9789927118968/9789927118968-ch09.html?itemId=/content/chapter/9789927118968.b_9789927118968-ch09&mimeType=html&fmt=ahah
Kuwait City
Hamad bin Khalifa University Press (HBKU Press) , 174 (٢٠١٨); https://doi.org/10.5339/GSU.9789927118968_3
/content/chapter/9789927118968.b_9789927118968-ch09
/content/chapter/9789927118968.b_9789927118968-ch09
عرض:
الأشكال
الأشكال
/content/figure/9789927118968.b_9789927118968-ch09.b-9789927118968_009-unfig1
Untitled
9789927118968/b-9789927118968_009-unfig1_thmb.gif
9789927118968/b-9789927118968_009-unfig1.gif
/content/figure/9789927118968.b_9789927118968-ch09.b-9789927118968_009-unfig2
Untitled
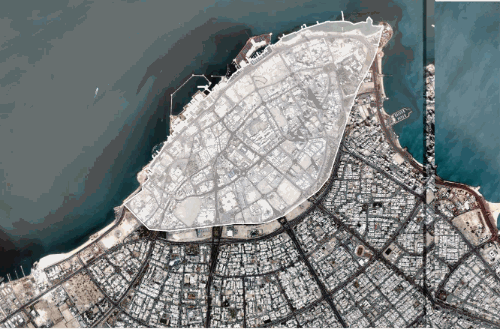
Kuwait City 2010
-
▸
Area: 200 km2
▸
Population: 2,380,000
▸
Density: 11,900/km2
9789927118968/b-9789927118968_009-unfig2_thmb.gif
9789927118968/b-9789927118968_009-unfig2.gif
Kuwait City 2010
-
▸
Area: 200 km2
▸
Population: 2,380,000
▸
Density: 11,900/km2
/content/figure/9789927118968.b_9789927118968-ch09.b-9789927118968_009-unfig3
Untitled
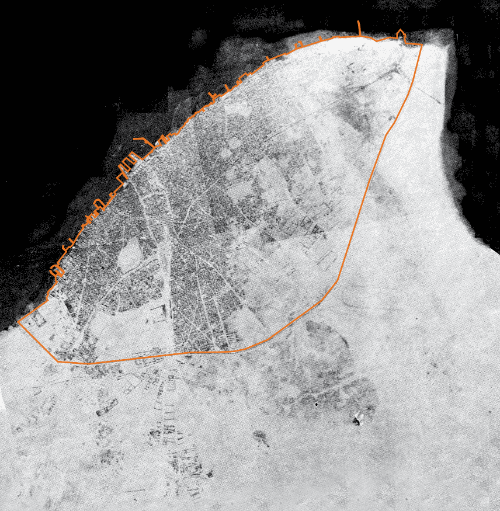
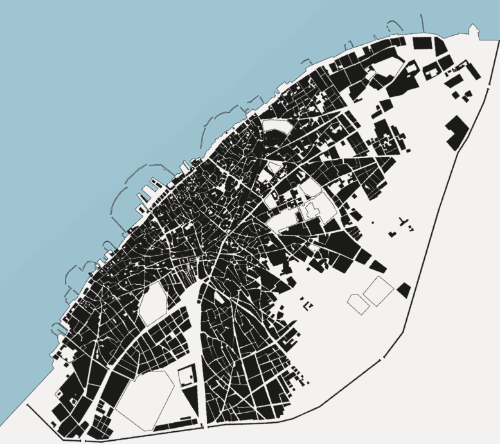
Kuwait City 1950
-
▸
Area: 9.4 km2
▸
Population: 120,000 approx
▸
Density: 12,766/km2
9789927118968/b-9789927118968_009-unfig3_thmb.gif
9789927118968/b-9789927118968_009-unfig3.gif
Kuwait City 1950
-
▸
Area: 9.4 km2
▸
Population: 120,000 approx
▸
Density: 12,766/km2
/content/figure/9789927118968.b_9789927118968-ch09.b-9789927118968_009-fig9.1
FIGURE 9.1
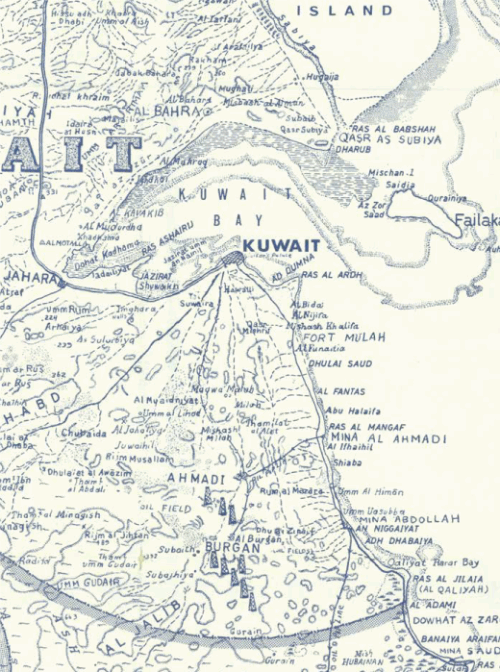
Historical map of Kuwait
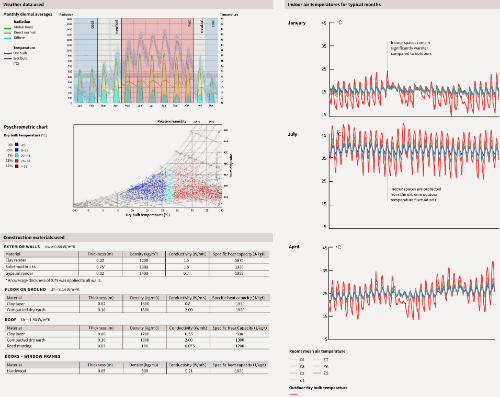
9789927118968/b-9789927118968_009-fig1_thmb.gif
9789927118968/b-9789927118968_009-fig1.gif
FIGURE 9.1
Historical map of Kuwait
/content/figure/9789927118968.b_9789927118968-ch09.b-9789927118968_009-fig9.2
FIGURE 9.2
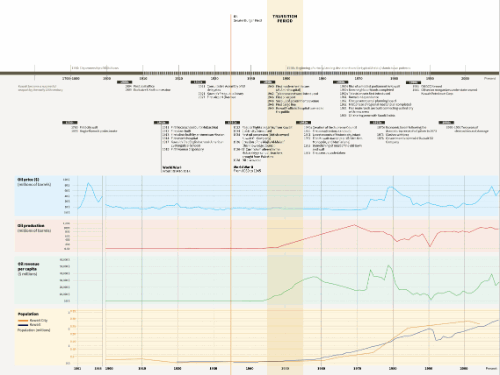
Economic and political timeline of Kuwait
9789927118968/b-9789927118968_009-fig2_thmb.gif
9789927118968/b-9789927118968_009-fig2.gif
FIGURE 9.2
Economic and political timeline of Kuwait
/content/figure/9789927118968.b_9789927118968-ch09.b-9789927118968_009-fig9.3
FIGURE 9.3
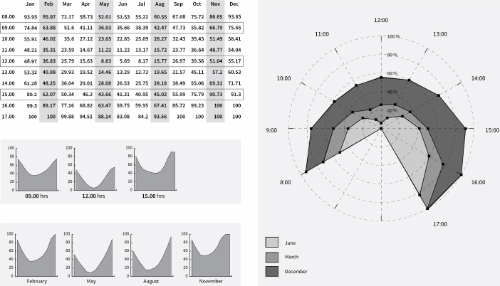
Temperature and humidity variation
9789927118968/b-9789927118968_009-fig3_thmb.gif
9789927118968/b-9789927118968_009-fig3.gif
FIGURE 9.3
Temperature and humidity variation
/content/figure/9789927118968.b_9789927118968-ch09.b-9789927118968_009-fig9.4
FIGURE 9.4
Outdoor dry bulb temperature for Kuwait
Each column represents one day, each cell represents one hour
9789927118968/b-9789927118968_009-fig4_thmb.gif
9789927118968/b-9789927118968_009-fig4.gif
FIGURE 9.4
Outdoor dry bulb temperature for Kuwait
Each column represents one day, each cell represents one hour
/content/figure/9789927118968.b_9789927118968-ch09.b-9789927118968_009-fig9.5
FIGURE 9.5
Annual temperature profile
9789927118968/b-9789927118968_009-fig5_thmb.gif
9789927118968/b-9789927118968_009-fig5.gif
FIGURE 9.5
Annual temperature profile
/content/figure/9789927118968.b_9789927118968-ch09.b-9789927118968_009-fig9.6
FIGURE 9.6
Annual heat index
9789927118968/b-9789927118968_009-fig6_thmb.gif
9789927118968/b-9789927118968_009-fig6.gif
FIGURE 9.6
Annual heat index
/content/figure/9789927118968.b_9789927118968-ch09.b-9789927118968_009-fig9.7
FIGURE 9.7
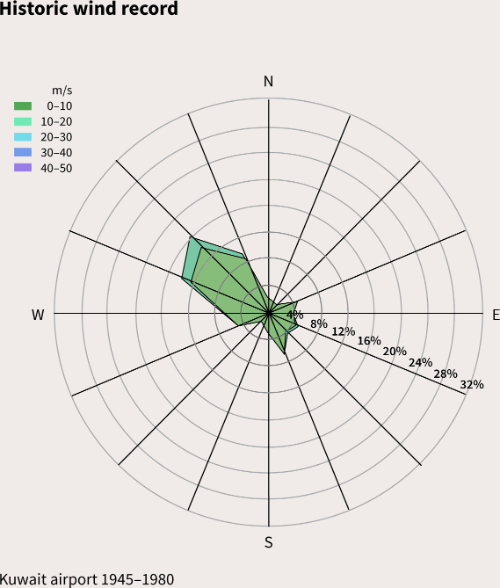
Wind variations
9789927118968/b-9789927118968_009-fig7_thmb.gif
9789927118968/b-9789927118968_009-fig7.gif
FIGURE 9.7
Wind variations
/content/figure/9789927118968.b_9789927118968-ch09.b-9789927118968_009-img9.1
IMAGE 9.1
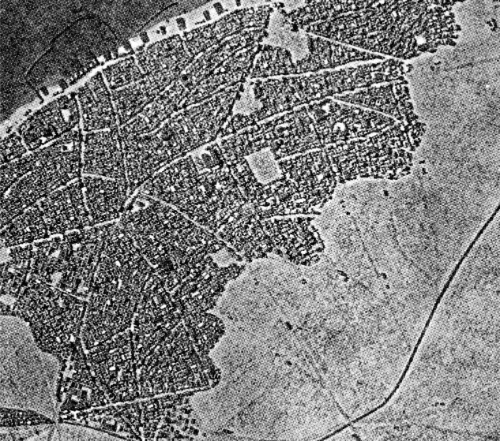
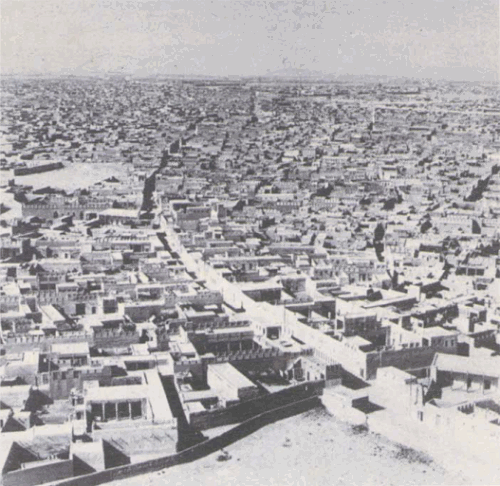
Aerial view of old Kuwait City
9789927118968/b-9789927118968_009-img1_thmb.gif
9789927118968/b-9789927118968_009-img1.gif
IMAGE 9.1
Aerial view of old Kuwait City
/content/figure/9789927118968.b_9789927118968-ch09.b-9789927118968_009-fig9.8
FIGURE 9.8
Timeline of Kuwait
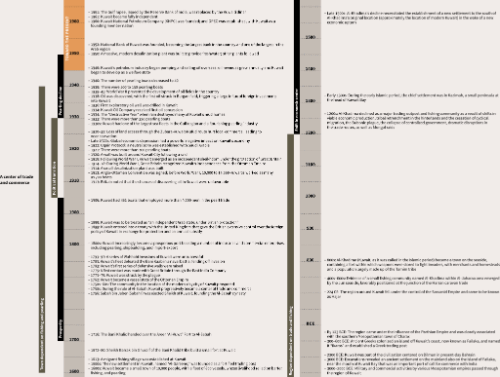
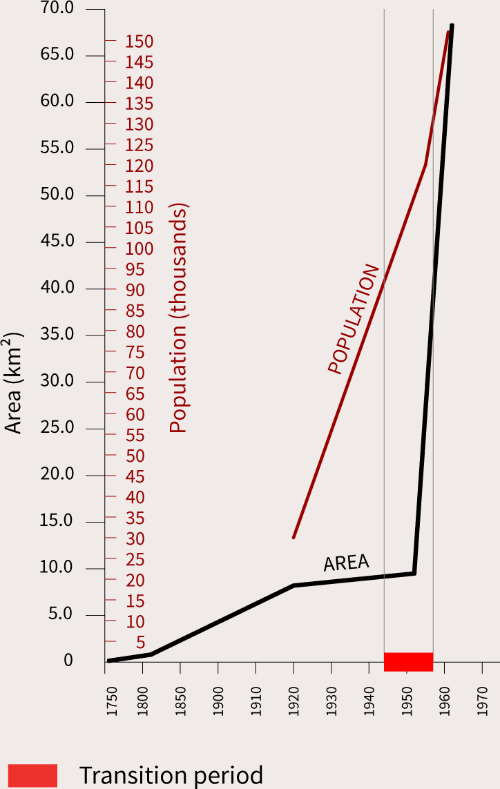
The past-to-present transitionary period for Kuwait City is identified as the years from 1945 to 1955. Major infrastructure projects and demolitions of entire city quarters were undertaken during this period. In 1946, Kuwait exported its first oil barrel, established its first cargo line, and saw a primary surplus in the state budget. In 1949, the first official modern hospital opened to the public, and in 1950 the first desalinization plant was built. In 1952, the first city master plan was prepared by the British firm, Monoprio and MacFarlane, and was followed, in subsequent years, by the demolition of the majority of the old town.
The transitionary period for Kuwait City is one of the clearest to define, primarily due to the concentrated demolitions of the historic fabric that happened during the early 1950s and 1960s. However, certain irregularities exist also for this case, with oil discovery and oil exploration having almost ten years in-between them, a probable derivative of World War II. Moreover, civil and social infrastructure was already being built from 1910, with the first clinic established in 1913 and the first men’s hospital in 1914. Kuwait’s first public library was founded in 1921, the first airport was built in 1927, and electricity was introduced in 1934.
9789927118968/b-9789927118968_009-fig8_thmb.gif
9789927118968/b-9789927118968_009-fig8.gif
FIGURE 9.8
Timeline of Kuwait
The past-to-present transitionary period for Kuwait City is identified as the years from 1945 to 1955. Major infrastructure projects and demolitions of entire city quarters were undertaken during this period. In 1946, Kuwait exported its first oil barrel, established its first cargo line, and saw a primary surplus in the state budget. In 1949, the first official modern hospital opened to the public, and in 1950 the first desalinization plant was built. In 1952, the first city master plan was prepared by the British firm, Monoprio and MacFarlane, and was followed, in subsequent years, by the demolition of the majority of the old town.
The transitionary period for Kuwait City is one of the clearest to define, primarily due to the concentrated demolitions of the historic fabric that happened during the early 1950s and 1960s. However, certain irregularities exist also for this case, with oil discovery and oil exploration having almost ten years in-between them, a probable derivative of World War II. Moreover, civil and social infrastructure was already being built from 1910, with the first clinic established in 1913 and the first men’s hospital in 1914. Kuwait’s first public library was founded in 1921, the first airport was built in 1927, and electricity was introduced in 1934.
/content/figure/9789927118968.b_9789927118968-ch09.b-9789927118968_009-unfig4
Untitled
9789927118968/b-9789927118968_009-unfig4_thmb.gif
9789927118968/b-9789927118968_009-unfig4.gif
/content/figure/9789927118968.b_9789927118968-ch09.b-9789927118968_009-fig9.9
FIGURE 9.9
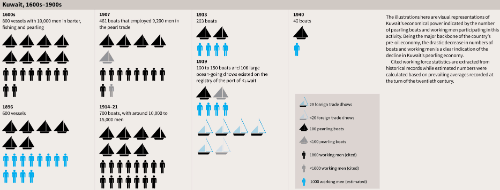
Pre-oil shipping industry
9789927118968/b-9789927118968_009-fig9_thmb.gif
9789927118968/b-9789927118968_009-fig9.gif
FIGURE 9.9
Pre-oil shipping industry
/content/figure/9789927118968.b_9789927118968-ch09.b-9789927118968_009-fig9.10
FIGURE 9.10
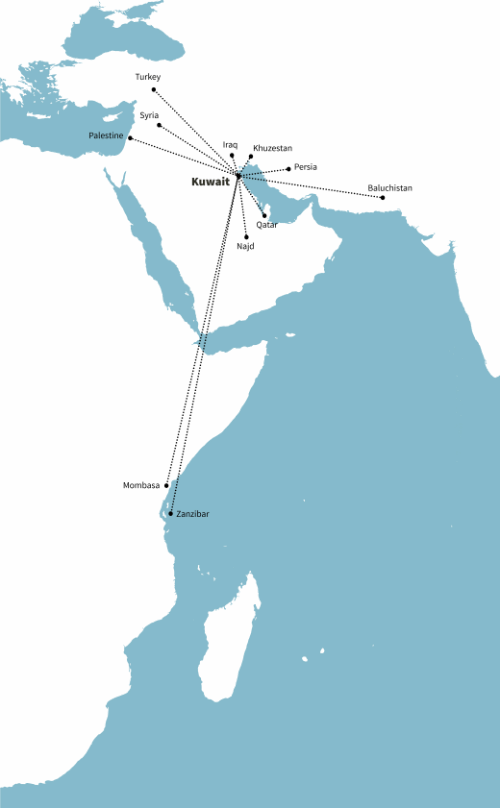
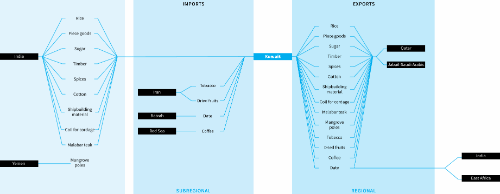
Regional and subregional imports and exports
9789927118968/b-9789927118968_009-fig10_thmb.gif
9789927118968/b-9789927118968_009-fig10.gif
FIGURE 9.10
Regional and subregional imports and exports
/content/figure/9789927118968.b_9789927118968-ch09.b-9789927118968_009-fig9.11
FIGURE 9.11
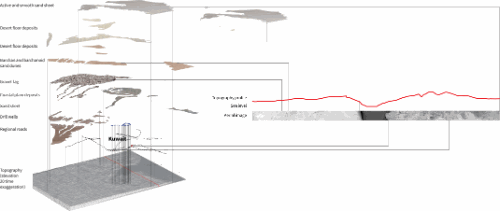
Land morphology and topography
9789927118968/b-9789927118968_009-fig11_thmb.gif
9789927118968/b-9789927118968_009-fig11.gif
FIGURE 9.11
Land morphology and topography
/content/figure/9789927118968.b_9789927118968-ch09.b-9789927118968_009-fig9.12
FIGURE 9.12
Prominent landscape features
9789927118968/b-9789927118968_009-fig12_thmb.gif
9789927118968/b-9789927118968_009-fig12.gif
FIGURE 9.12
Prominent landscape features
/content/figure/9789927118968.b_9789927118968-ch09.b-9789927118968_009-fig9.13
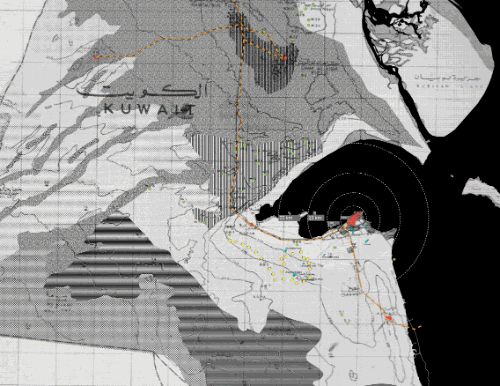
FIGURE 9.13
Landform and urban infrastructure, 1960
9789927118968/b-9789927118968_009-fig13_thmb.gif
9789927118968/b-9789927118968_009-fig13.gif
FIGURE 9.13
Landform and urban infrastructure, 1960
/content/figure/9789927118968.b_9789927118968-ch09.b-9789927118968_009-fig9.14
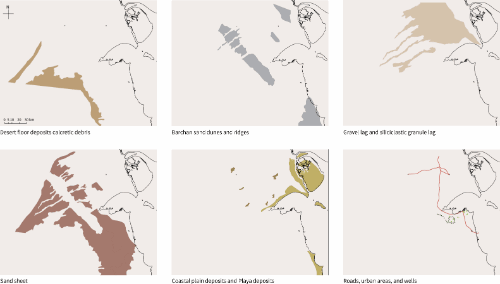
FIGURE 9.14
Urban settlements and geomorphology, 1965
 Wells
Wells
 Production water wells
 Roads
Roads
 Urban area
 Gravel lag
 Deflated rugges sand sheets
 Fall dunes
 Desert floor deposits calcretive debris
 Smooth sand sheets
 Active sand sheets
 Barchan sand dunes
 Desert floor deposits siliciala stic granule lag
 Coastal plain deposits
9789927118968/b-9789927118968_009-fig14_thmb.gif
9789927118968/b-9789927118968_009-fig14.gif
FIGURE 9.14
Urban settlements and geomorphology, 1965
 Wells
Wells
 Production water wells
 Roads
Roads
 Urban area
 Gravel lag
 Deflated rugges sand sheets
 Fall dunes
 Desert floor deposits calcretive debris
 Smooth sand sheets
 Active sand sheets
 Barchan sand dunes
 Desert floor deposits siliciala stic granule lag
 Coastal plain deposits
/content/figure/9789927118968.b_9789927118968-ch09.b-9789927118968_009-fig9.15
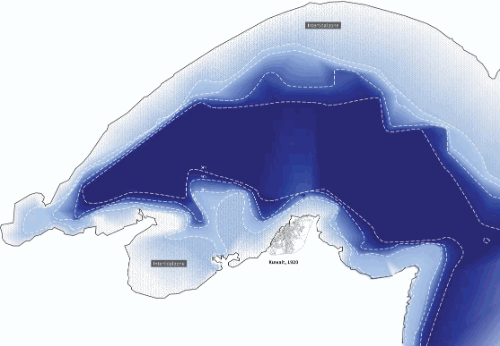
FIGURE 9.15
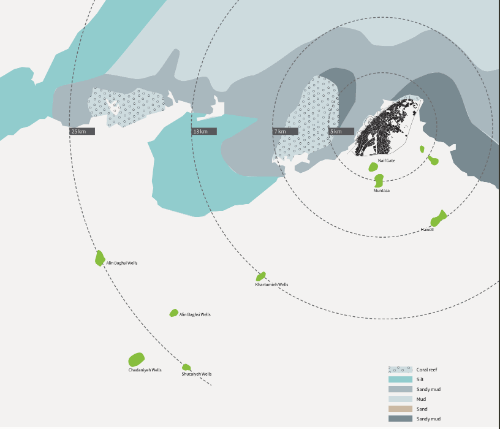
Water depth of Kuwait Bay
9789927118968/b-9789927118968_009-fig15_thmb.gif
9789927118968/b-9789927118968_009-fig15.gif
FIGURE 9.15
Water depth of Kuwait Bay
/content/figure/9789927118968.b_9789927118968-ch09.b-9789927118968_009-fig9.16
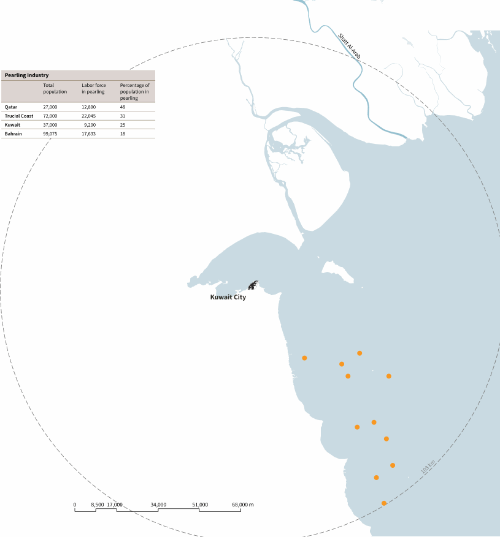
FIGURE 9.16
The pearling industry, 1940s
9789927118968/b-9789927118968_009-fig16_thmb.gif
9789927118968/b-9789927118968_009-fig16.gif
FIGURE 9.16
The pearling industry, 1940s
/content/figure/9789927118968.b_9789927118968-ch09.b-9789927118968_009-fig9.17
FIGURE 9.17
Hydrology and freshwater supply
9789927118968/b-9789927118968_009-fig17_thmb.gif
9789927118968/b-9789927118968_009-fig17.gif
FIGURE 9.17
Hydrology and freshwater supply
/content/figure/9789927118968.b_9789927118968-ch09.b-9789927118968_009-fig9.18
FIGURE 9.18
Growing freshwater demand
9789927118968/b-9789927118968_009-fig18_thmb.gif
9789927118968/b-9789927118968_009-fig18.gif
FIGURE 9.18
Growing freshwater demand
/content/figure/9789927118968.b_9789927118968-ch09.b-9789927118968_009-fig9.19
FIGURE 9.19
Kuwait, 1956
9789927118968/b-9789927118968_009-fig19_thmb.gif
9789927118968/b-9789927118968_009-fig19.gif
FIGURE 9.19
Kuwait, 1956
/content/figure/9789927118968.b_9789927118968-ch09.b-9789927118968_009-fig9.20
FIGURE 9.20
Evolution of the urban form
9789927118968/b-9789927118968_009-fig20_thmb.gif
9789927118968/b-9789927118968_009-fig20.gif
FIGURE 9.20
Evolution of the urban form
/content/figure/9789927118968.b_9789927118968-ch09.b-9789927118968_009-fig9.21
FIGURE 9.21
City evolution index
9789927118968/b-9789927118968_009-fig21_thmb.gif
9789927118968/b-9789927118968_009-fig21.gif
FIGURE 9.21
City evolution index
/content/figure/9789927118968.b_9789927118968-ch09.b-9789927118968_009-fig9.22
FIGURE 9.22
Area growth versus population growth
9789927118968/b-9789927118968_009-fig22_thmb.gif
9789927118968/b-9789927118968_009-fig22.gif
FIGURE 9.22
Area growth versus population growth
/content/figure/9789927118968.b_9789927118968-ch09.b-9789927118968_009-fig9.23
FIGURE 9.23
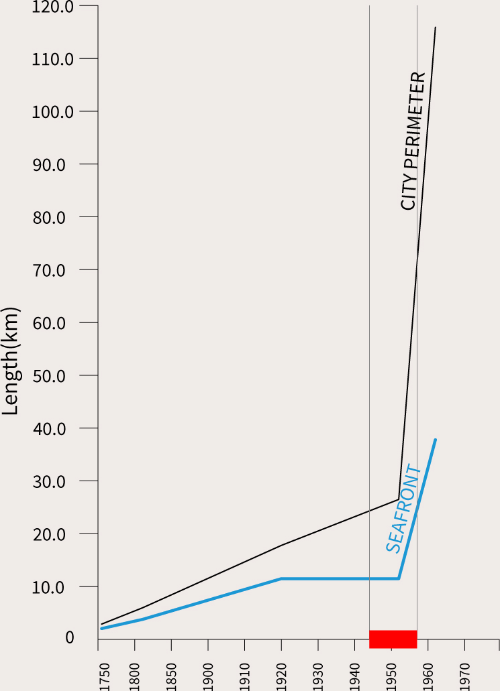
Seafront versus city perimeter
9789927118968/b-9789927118968_009-fig23_thmb.gif
9789927118968/b-9789927118968_009-fig23.gif
FIGURE 9.23
Seafront versus city perimeter
/content/figure/9789927118968.b_9789927118968-ch09.b-9789927118968_009-fig9.24
FIGURE 9.24
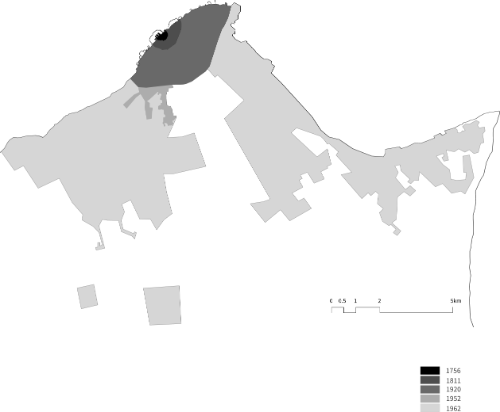
Urban growth, 1756–1962
9789927118968/b-9789927118968_009-fig24_thmb.gif
9789927118968/b-9789927118968_009-fig24.gif
FIGURE 9.24
Urban growth, 1756–1962
/content/figure/9789927118968.b_9789927118968-ch09.b-9789927118968_009-fig9.25
FIGURE 9.25
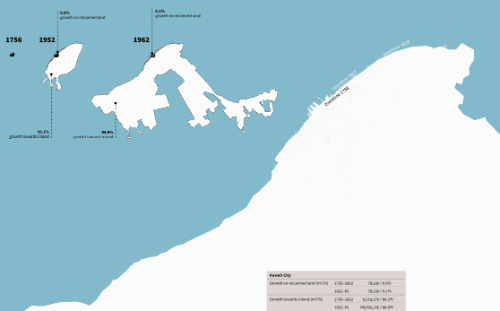
Evolution of the coastline
9789927118968/b-9789927118968_009-fig25_thmb.gif
9789927118968/b-9789927118968_009-fig25.gif
FIGURE 9.25
Evolution of the coastline
/content/figure/9789927118968.b_9789927118968-ch09.b-9789927118968_009-fig9.26
FIGURE 9.26
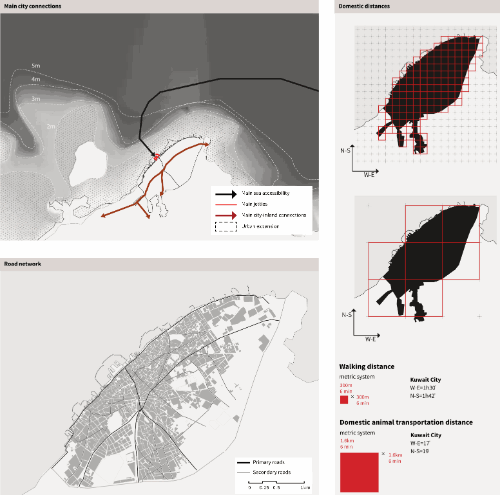
Accessibilities, road network, and domestic distances
9789927118968/b-9789927118968_009-fig26_thmb.gif
9789927118968/b-9789927118968_009-fig26.gif
FIGURE 9.26
Accessibilities, road network, and domestic distances
/content/figure/9789927118968.b_9789927118968-ch09.b-9789927118968_009-fig9.27
FIGURE 9.27
Urban landscape of Kuwait
9789927118968/b-9789927118968_009-fig27_thmb.gif
9789927118968/b-9789927118968_009-fig27.gif
FIGURE 9.27
Urban landscape of Kuwait
/content/figure/9789927118968.b_9789927118968-ch09.b-9789927118968_009-fig9.28
FIGURE 9.28
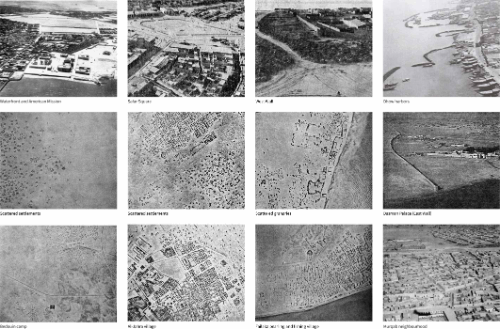
Views of Kuwait before the discovery of oil
9789927118968/b-9789927118968_009-fig28_thmb.gif
9789927118968/b-9789927118968_009-fig28.gif
FIGURE 9.28
Views of Kuwait before the discovery of oil
/content/figure/9789927118968.b_9789927118968-ch09.b-9789927118968_009-fig9.29
FIGURE 9.29
Land use and accessibility
9789927118968/b-9789927118968_009-fig29_thmb.gif
9789927118968/b-9789927118968_009-fig29.gif
FIGURE 9.29
Land use and accessibility
/content/figure/9789927118968.b_9789927118968-ch09.b-9789927118968_009-fig9.30
FIGURE 9.30
Land use and accessibility
9789927118968/b-9789927118968_009-fig30_thmb.gif
9789927118968/b-9789927118968_009-fig30.gif
FIGURE 9.30
Land use and accessibility
/content/figure/9789927118968.b_9789927118968-ch09.b-9789927118968_009-fig9.31
FIGURE 9.31
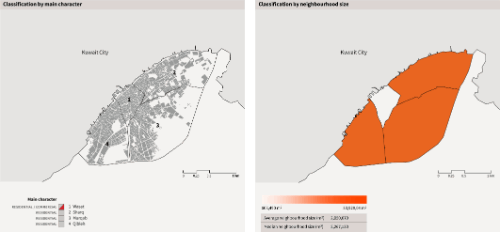
Neighbourhood classification
9789927118968/b-9789927118968_009-fig31_thmb.gif
9789927118968/b-9789927118968_009-fig31.gif
FIGURE 9.31
Neighbourhood classification
/content/figure/9789927118968.b_9789927118968-ch09.b-9789927118968_009-fig9.32
FIGURE 9.32
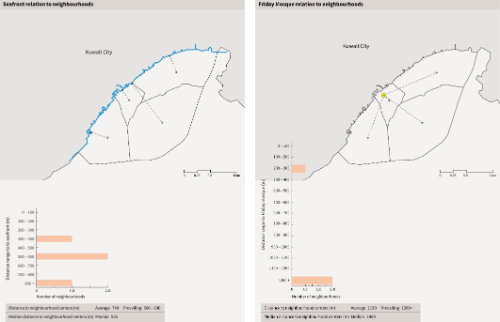
Neighbourhood analysis
9789927118968/b-9789927118968_009-fig32_thmb.gif
9789927118968/b-9789927118968_009-fig32.gif
FIGURE 9.32
Neighbourhood analysis
/content/figure/9789927118968.b_9789927118968-ch09.b-9789927118968_009-fig9.33
FIGURE 9.33
Urban components
9789927118968/b-9789927118968_009-fig33_thmb.gif
9789927118968/b-9789927118968_009-fig33.gif
FIGURE 9.33
Urban components
/content/figure/9789927118968.b_9789927118968-ch09.b-9789927118968_009-fig9.34
FIGURE 9.34
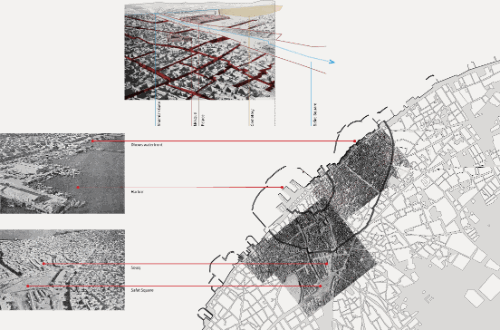
Kuwait waterfront, 1952
9789927118968/b-9789927118968_009-fig34_thmb.gif
9789927118968/b-9789927118968_009-fig34.gif
FIGURE 9.34
Kuwait waterfront, 1952
/content/figure/9789927118968.b_9789927118968-ch09.b-9789927118968_009-fig9.35
FIGURE 9.35
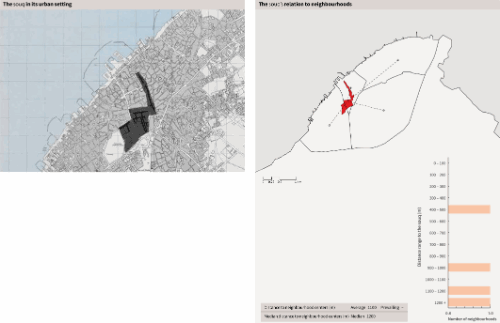
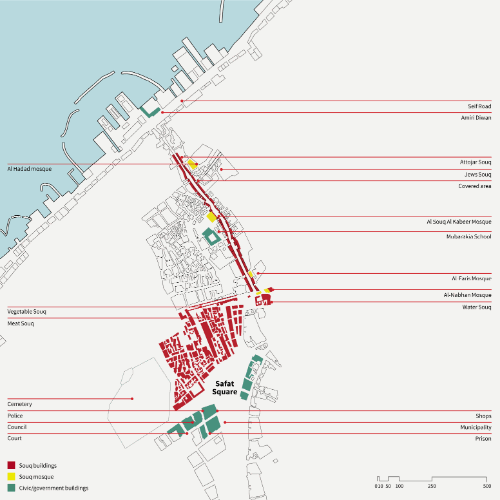
Souq analysis
9789927118968/b-9789927118968_009-fig35_thmb.gif
9789927118968/b-9789927118968_009-fig35.gif
FIGURE 9.35
Souq analysis
/content/figure/9789927118968.b_9789927118968-ch09.b-9789927118968_009-fig9.36
FIGURE 9.36
Kuwait souqs, 1952
9789927118968/b-9789927118968_009-fig36_thmb.gif
9789927118968/b-9789927118968_009-fig36.gif
FIGURE 9.36
Kuwait souqs, 1952
/content/figure/9789927118968.b_9789927118968-ch09.b-9789927118968_009-img9.2
IMAGE 9.2
An oblique 1940s view of the old Sharq district showing the curving path created by the second city wall
9789927118968/b-9789927118968_009-img2_thmb.gif
9789927118968/b-9789927118968_009-img2.gif
IMAGE 9.2
An oblique 1940s view of the old Sharq district showing the curving path created by the second city wall
/content/figure/9789927118968.b_9789927118968-ch09.b-9789927118968_009-fig9.37
FIGURE 9.37
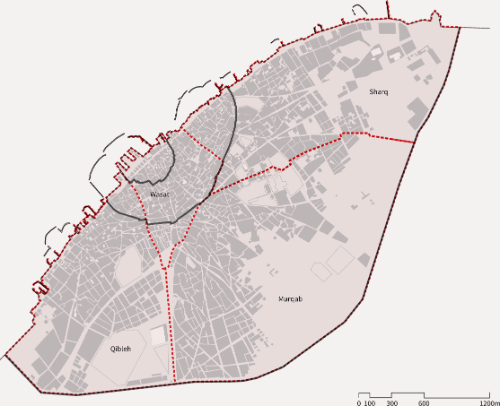
Kuwait City districts
9789927118968/b-9789927118968_009-fig37_thmb.gif
9789927118968/b-9789927118968_009-fig37.gif
FIGURE 9.37
Kuwait City districts
/content/figure/9789927118968.b_9789927118968-ch09.b-9789927118968_009-fig9.38
FIGURE 9.38
Al-Bader Farij
9789927118968/b-9789927118968_009-fig38_thmb.gif
9789927118968/b-9789927118968_009-fig38.gif
FIGURE 9.38
Al-Bader Farij
/content/figure/9789927118968.b_9789927118968-ch09.b-9789927118968_009-fig9.39
FIGURE 9.39
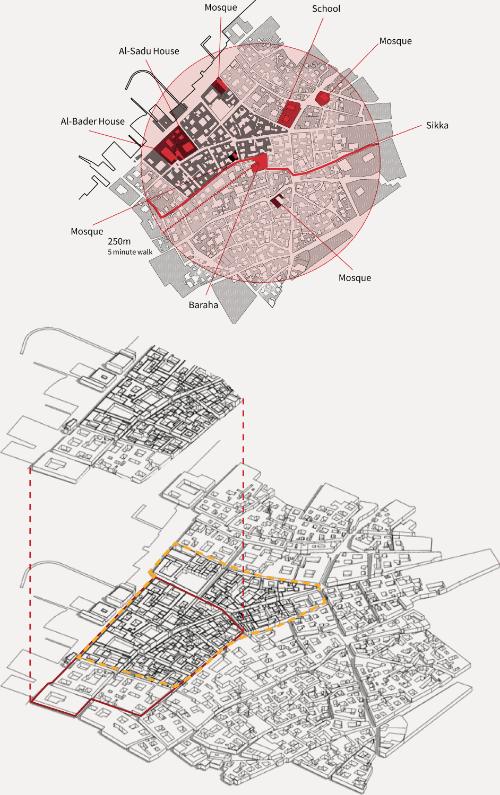
Neighbourhood analysis
9789927118968/b-9789927118968_009-fig39_thmb.gif
9789927118968/b-9789927118968_009-fig39.gif
FIGURE 9.39
Neighbourhood analysis
/content/figure/9789927118968.b_9789927118968-ch09.b-9789927118968_009-fig9.40
FIGURE 9.40
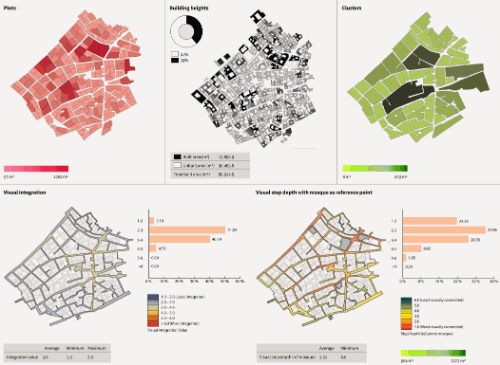
Neighbourhood analysis
9789927118968/b-9789927118968_009-fig40_thmb.gif
9789927118968/b-9789927118968_009-fig40.gif
FIGURE 9.40
Neighbourhood analysis
/content/figure/9789927118968.b_9789927118968-ch09.b-9789927118968_009-fig9.41
FIGURE 9.41
Neighbourhood analysis
9789927118968/b-9789927118968_009-fig41_thmb.gif
9789927118968/b-9789927118968_009-fig41.gif
FIGURE 9.41
Neighbourhood analysis
/content/figure/9789927118968.b_9789927118968-ch09.b-9789927118968_009-fig9.42
FIGURE 9.42
Views of Kuwait: walking through the city
9789927118968/b-9789927118968_009-fig42_thmb.gif
9789927118968/b-9789927118968_009-fig42.gif
FIGURE 9.42
Views of Kuwait: walking through the city
/content/figure/9789927118968.b_9789927118968-ch09.b-9789927118968_009-fig9.43
FIGURE 9.43
Shading analysis of Al-Bader
9789927118968/b-9789927118968_009-fig43_thmb.gif
9789927118968/b-9789927118968_009-fig43.gif
FIGURE 9.43
Shading analysis of Al-Bader
/content/figure/9789927118968.b_9789927118968-ch09.b-9789927118968_009-fig9.44
FIGURE 9.44
3D representation of shading in Al-Bader
9789927118968/b-9789927118968_009-fig44_thmb.gif
9789927118968/b-9789927118968_009-fig44.gif
FIGURE 9.44
3D representation of shading in Al-Bader
/content/figure/9789927118968.b_9789927118968-ch09.b-9789927118968_009-fig9.45
FIGURE 9.45
Aerial view of shading in section of Al-Bader and adjacent districts
9789927118968/b-9789927118968_009-fig45_thmb.gif
9789927118968/b-9789927118968_009-fig45.gif
FIGURE 9.45
Aerial view of shading in section of Al-Bader and adjacent districts
/content/figure/9789927118968.b_9789927118968-ch09.b-9789927118968_009-fig9.46
FIGURE 9.46
Annual radiation in Al-Bader
9789927118968/b-9789927118968_009-fig46_thmb.gif
9789927118968/b-9789927118968_009-fig46.gif
FIGURE 9.46
Annual radiation in Al-Bader
/content/figure/9789927118968.b_9789927118968-ch09.b-9789927118968_009-img9.3
IMAGE 9.3
Old Kuwait City
9789927118968/b-9789927118968_009-img3_thmb.gif
9789927118968/b-9789927118968_009-img3.gif
IMAGE 9.3
Old Kuwait City
/content/figure/9789927118968.b_9789927118968-ch09.b-9789927118968_009-fig9.47
FIGURE 9.47
Location of analyzed units
9789927118968/b-9789927118968_009-fig47_thmb.gif
9789927118968/b-9789927118968_009-fig47.gif
FIGURE 9.47
Location of analyzed units
/content/figure/9789927118968.b_9789927118968-ch09.b-9789927118968_009-unfig5
Untitled
9789927118968/b-9789927118968_009-unfig5_thmb.gif
9789927118968/b-9789927118968_009-unfig5.gif
/content/figure/9789927118968.b_9789927118968-ch09.b-9789927118968_009-unfig6
Untitled
9789927118968/b-9789927118968_009-unfig6_thmb.gif
9789927118968/b-9789927118968_009-unfig6.gif
/content/figure/9789927118968.b_9789927118968-ch09.b-9789927118968_009-fig9.48
FIGURE 9.48
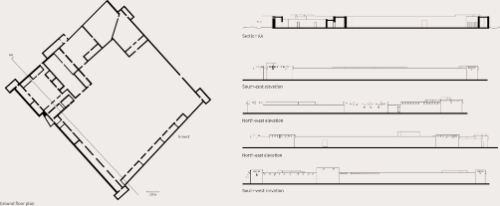
Plan and elevations
9789927118968/b-9789927118968_009-fig48_thmb.gif
9789927118968/b-9789927118968_009-fig48.gif
FIGURE 9.48
Plan and elevations
/content/figure/9789927118968.b_9789927118968-ch09.b-9789927118968_009-unfig7
Untitled
9789927118968/b-9789927118968_009-unfig7_thmb.gif
9789927118968/b-9789927118968_009-unfig7.gif
/content/figure/9789927118968.b_9789927118968-ch09.b-9789927118968_009-fig9.49
FIGURE 9.49
Plan and elevations
9789927118968/b-9789927118968_009-fig49_thmb.gif
9789927118968/b-9789927118968_009-fig49.gif
FIGURE 9.49
Plan and elevations
/content/figure/9789927118968.b_9789927118968-ch09.b-9789927118968_009-fig9.50
FIGURE 9.50
Plans
9789927118968/b-9789927118968_009-fig50_thmb.gif
9789927118968/b-9789927118968_009-fig50.gif
FIGURE 9.50
Plans
/content/figure/9789927118968.b_9789927118968-ch09.b-9789927118968_009-unfig8
Untitled
9789927118968/b-9789927118968_009-unfig8_thmb.gif
9789927118968/b-9789927118968_009-unfig8.gif
/content/figure/9789927118968.b_9789927118968-ch09.b-9789927118968_009-fig9.51
FIGURE 9.51
Plan and elevations
9789927118968/b-9789927118968_009-fig51_thmb.gif
9789927118968/b-9789927118968_009-fig51.gif
FIGURE 9.51
Plan and elevations
/content/figure/9789927118968.b_9789927118968-ch09.b-9789927118968_009-fig9.52
FIGURE 9.52
Plan and elevation
9789927118968/b-9789927118968_009-fig52_thmb.gif
9789927118968/b-9789927118968_009-fig52.gif
FIGURE 9.52
Plan and elevation
/content/figure/9789927118968.b_9789927118968-ch09.b-9789927118968_009-fig9.53
FIGURE 9.53
Plan and elevation
9789927118968/b-9789927118968_009-fig53_thmb.gif
9789927118968/b-9789927118968_009-fig53.gif
FIGURE 9.53
Plan and elevation
/content/figure/9789927118968.b_9789927118968-ch09.b-9789927118968_009-img9.4
IMAGE 9.4
Views of Jahra Red Fort
9789927118968/b-9789927118968_009-img4_thmb.gif
9789927118968/b-9789927118968_009-img4.gif
IMAGE 9.4
Views of Jahra Red Fort
/content/figure/9789927118968.b_9789927118968-ch09.b-9789927118968_009-fig9.54
FIGURE 9.54
Plan and elevations
9789927118968/b-9789927118968_009-fig54_thmb.gif
9789927118968/b-9789927118968_009-fig54.gif
FIGURE 9.54
Plan and elevations
/content/figure/9789927118968.b_9789927118968-ch09.b-9789927118968_009-fig9.55
FIGURE 9.55
Configuration analysis
9789927118968/b-9789927118968_009-fig55_thmb.gif
9789927118968/b-9789927118968_009-fig55.gif
FIGURE 9.55
Configuration analysis
/content/figure/9789927118968.b_9789927118968-ch09.b-9789927118968_009-fig9.56
FIGURE 9.56
Configuration analysis
9789927118968/b-9789927118968_009-fig56_thmb.gif
9789927118968/b-9789927118968_009-fig56.gif
FIGURE 9.56
Configuration analysis
/content/figure/9789927118968.b_9789927118968-ch09.b-9789927118968_009-unfig9
Untitled
9789927118968/b-9789927118968_009-unfig9_thmb.gif
9789927118968/b-9789927118968_009-unfig9.gif
/content/figure/9789927118968.b_9789927118968-ch09.b-9789927118968_009-fig9.57
FIGURE 9.57
Visibility graphs
9789927118968/b-9789927118968_009-fig57_thmb.gif
9789927118968/b-9789927118968_009-fig57.gif
FIGURE 9.57
Visibility graphs
/content/figure/9789927118968.b_9789927118968-ch09.b-9789927118968_009-fig9.58
FIGURE 9.58
Justified Permeability Graphs
9789927118968/b-9789927118968_009-fig58_thmb.gif
9789927118968/b-9789927118968_009-fig58.gif
FIGURE 9.58
Justified Permeability Graphs
/content/figure/9789927118968.b_9789927118968-ch09.b-9789927118968_009-fig9.58a
Untitled
9789927118968/b-9789927118968_009-fig58a_thmb.gif
9789927118968/b-9789927118968_009-fig58a.gif
/content/figure/9789927118968.b_9789927118968-ch09.b-9789927118968_009-unfig10
Untitled
9789927118968/b-9789927118968_009-unfig10_thmb.gif
9789927118968/b-9789927118968_009-unfig10.gif
/content/figure/9789927118968.b_9789927118968-ch09.b-9789927118968_009-fig9.59
FIGURE 9.59
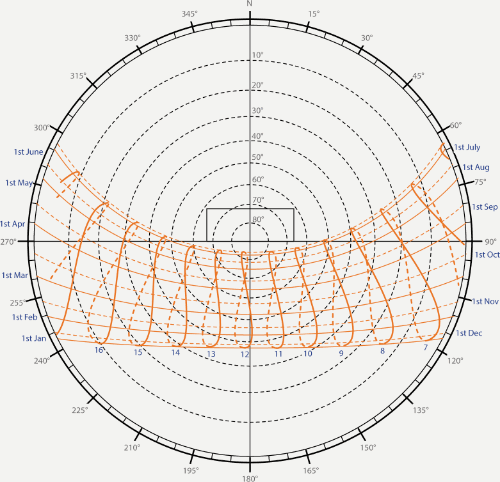
Shading analysis
9789927118968/b-9789927118968_009-fig59_thmb.gif
9789927118968/b-9789927118968_009-fig59.gif
FIGURE 9.59
Shading analysis
/content/figure/9789927118968.b_9789927118968-ch09.b-9789927118968_009-unfig11
Untitled
9789927118968/b-9789927118968_009-unfig11_thmb.gif
9789927118968/b-9789927118968_009-unfig11.gif
/content/figure/9789927118968.b_9789927118968-ch09.b-9789927118968_009-unfig12
Untitled
9789927118968/b-9789927118968_009-unfig12_thmb.gif
9789927118968/b-9789927118968_009-unfig12.gif
/content/figure/9789927118968.b_9789927118968-ch09.b-9789927118968_009-unfig13
Untitled
9789927118968/b-9789927118968_009-unfig13_thmb.gif
9789927118968/b-9789927118968_009-unfig13.gif
/content/figure/9789927118968.b_9789927118968-ch09.b-9789927118968_009-fig9.60
FIGURE 9.60
Shading profile
9789927118968/b-9789927118968_009-fig60_thmb.gif
9789927118968/b-9789927118968_009-fig60.gif
FIGURE 9.60
Shading profile
/content/figure/9789927118968.b_9789927118968-ch09.b-9789927118968_009-fig9.61
FIGURE 9.61
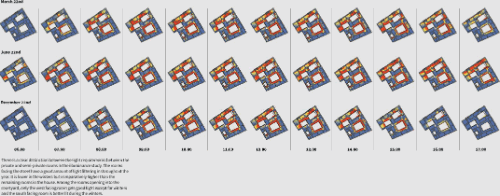
Daylighting analysis
9789927118968/b-9789927118968_009-fig61_thmb.gif
9789927118968/b-9789927118968_009-fig61.gif
FIGURE 9.61
Daylighting analysis
/content/figure/9789927118968.b_9789927118968-ch09.b-9789927118968_009-fig9.62
FIGURE 9.62
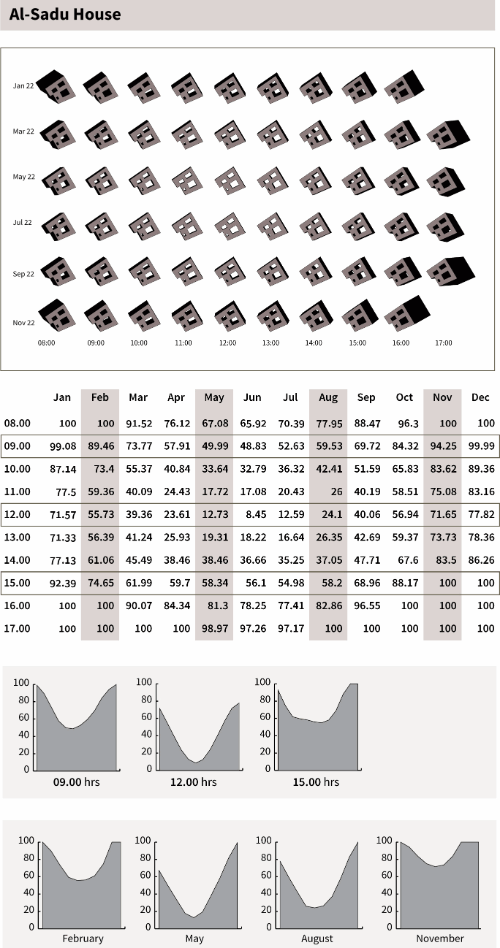
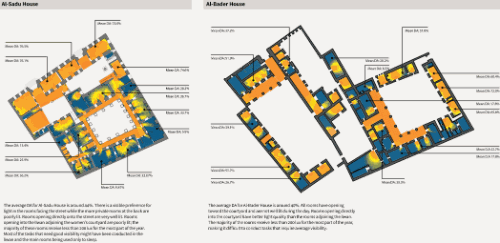
Illuminance: Al-Sadu House
9789927118968/b-9789927118968_009-fig62_thmb.gif
9789927118968/b-9789927118968_009-fig62.gif
FIGURE 9.62
Illuminance: Al-Sadu House
/content/figure/9789927118968.b_9789927118968-ch09.b-9789927118968_009-fig9.63
FIGURE 9.63
Thermal analysis of the unit
9789927118968/b-9789927118968_009-fig63_thmb.gif
9789927118968/b-9789927118968_009-fig63.gif
FIGURE 9.63
Thermal analysis of the unit
/content/figure/9789927118968.b_9789927118968-ch09.b-9789927118968_009-fig9.64
FIGURE 9.64
Thermal analysis
9789927118968/b-9789927118968_009-fig64_thmb.gif
9789927118968/b-9789927118968_009-fig64.gif
FIGURE 9.64
Thermal analysis
/content/figure/9789927118968.b_9789927118968-ch09.b-9789927118968_009-fig9.64a
Untitled
9789927118968/b-9789927118968_009-fig64a_thmb.gif
9789927118968/b-9789927118968_009-fig64a.gif
/content/figure/9789927118968.b_9789927118968-ch09.b-9789927118968_009-fig9.65
FIGURE 9.65
Exposure of the unit
9789927118968/b-9789927118968_009-fig65_thmb.gif
9789927118968/b-9789927118968_009-fig65.gif
FIGURE 9.65
Exposure of the unit
/content/figure/9789927118968.b_9789927118968-ch09.b-9789927118968_009-fig9.66
FIGURE 9.66
Floor area ratios
9789927118968/b-9789927118968_009-fig66_thmb.gif
9789927118968/b-9789927118968_009-fig66.gif
FIGURE 9.66
Floor area ratios
/content/figure/9789927118968.b_9789927118968-ch09.b-9789927118968_009-unfig14
Untitled
9789927118968/b-9789927118968_009-unfig14_thmb.gif
9789927118968/b-9789927118968_009-unfig14.gif
/content/figure/9789927118968.b_9789927118968-ch09.b-9789927118968_009-fig9.67
FIGURE 9.67
Plot subdivision process
9789927118968/b-9789927118968_009-fig67_thmb.gif
9789927118968/b-9789927118968_009-fig67.gif
FIGURE 9.67
Plot subdivision process
/content/figure/9789927118968.b_9789927118968-ch09.b-9789927118968_009-fig9.68
FIGURE 9.68
Old Kuwait urban morphology
9789927118968/b-9789927118968_009-fig68_thmb.gif
9789927118968/b-9789927118968_009-fig68.gif
FIGURE 9.68
Old Kuwait urban morphology
-
From This Site
/content/chapter/9789927118968.b_9789927118968-ch09dcterms_subject,pub_keyword-contentType:Journal -contentType:Figure -contentType:Table -contentType:SupplementaryData105
/content/chapter/9789927118968.b_9789927118968-ch09
dcterms_subject,pub_keyword
-contentType:Journal -contentType:Figure -contentType:Table -contentType:SupplementaryData
10
5
Chapter
content/book/9789927118968
Book
true
ar


