oa Doha
Access full text
Chapter
- Authors: Prof. Spiro N. Pollalis and Nader Ardalan
- Source: Gulf Sustainable Urbanism – Past, Volume I , pp 26-113
- Publication Date: December 2018
- DOI: https://doi.org/10.5339/GSU.9789927118951_3

Full text loading...
/deliver/fulltext/9789927118951/9789927118951-ch02.html?itemId=/content/chapter/9789927118951.b_9789927118951-ch02&mimeType=html&fmt=ahah
Doha
Hamad bin Khalifa University Press (HBKU Press) , 26 (2018); https://doi.org/10.5339/GSU.9789927118951_3
/content/chapter/9789927118951.b_9789927118951-ch02
/content/chapter/9789927118951.b_9789927118951-ch02
Figures
/content/figure/9789927118951.b_9789927118951-ch02.b-9789927118951_002-unfig1
Untitled
9789927118951/b-9789927118951_002-unfig1_thmb.gif
9789927118951/b-9789927118951_002-unfig1.gif
/content/figure/9789927118951.b_9789927118951-ch02.b-9789927118951_002-unfig2
Untitled
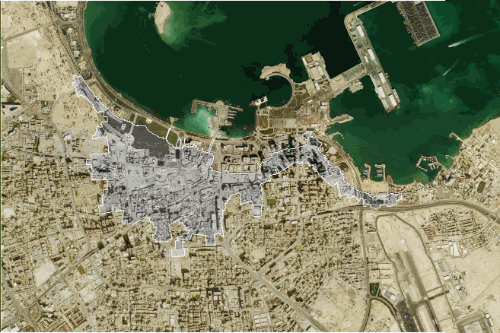
Doha 2010
-
▸
Area: 132 km2
▸
Population: 1,450,000
▸
Density: 11,000/km2
9789927118951/b-9789927118951_002-unfig2_thmb.gif
9789927118951/b-9789927118951_002-unfig2.gif
Doha 2010
-
▸
Area: 132 km2
▸
Population: 1,450,000
▸
Density: 11,000/km2
/content/figure/9789927118951.b_9789927118951-ch02.b-9789927118951_002-unfig3
Untitled
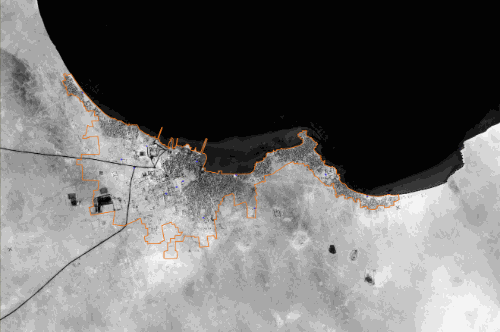
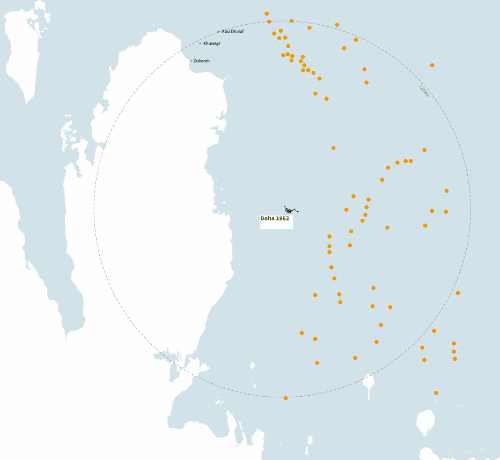
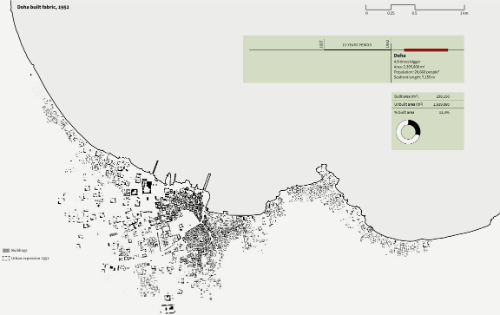
Doha 1952
-
▸
2.4 km2
▸
Population: 20,660 approx.
▸
Density: 8,608/km2
9789927118951/b-9789927118951_002-unfig3_thmb.gif
9789927118951/b-9789927118951_002-unfig3.gif
Doha 1952
-
▸
2.4 km2
▸
Population: 20,660 approx.
▸
Density: 8,608/km2
/content/figure/9789927118951.b_9789927118951-ch02.b-9789927118951_002-fig2.1
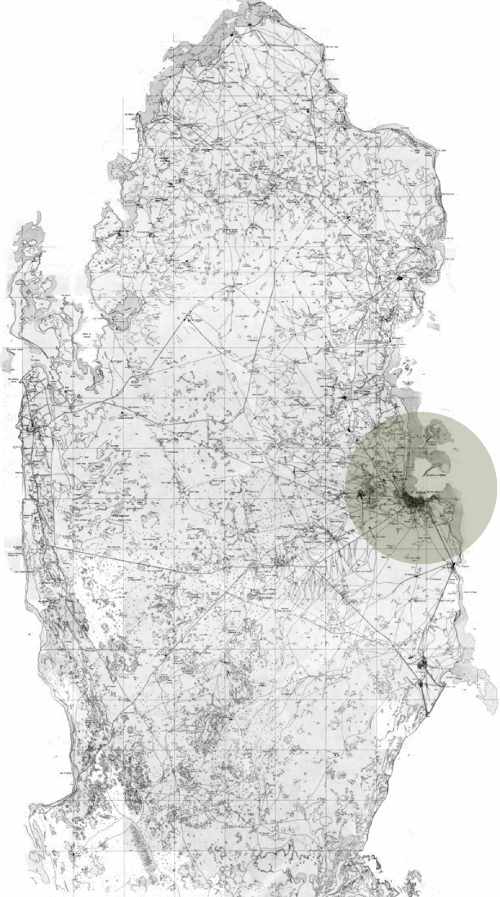
FIGURE 2.1
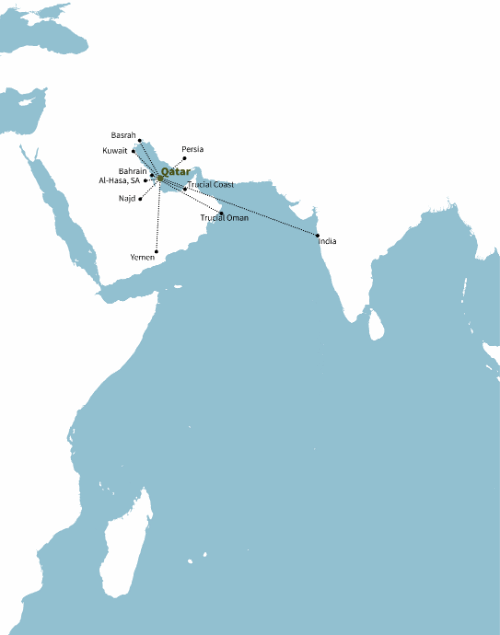
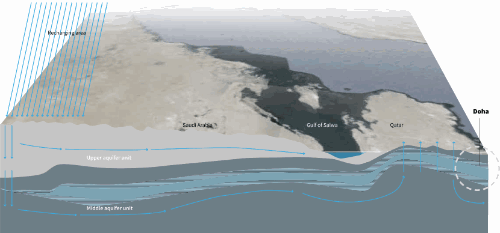
Map of Qatar
9789927118951/b-9789927118951_002-fig1_thmb.gif
9789927118951/b-9789927118951_002-fig1.gif
FIGURE 2.1
Map of Qatar
/content/figure/9789927118951.b_9789927118951-ch02.b-9789927118951_002-fig2.2
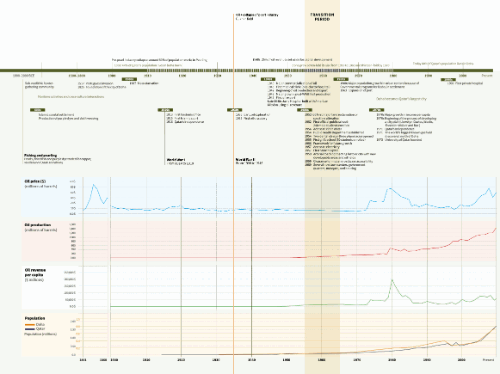
FIGURE 2.2
Economic and political timeline of Qatar
9789927118951/b-9789927118951_002-fig2_thmb.gif
9789927118951/b-9789927118951_002-fig2.gif
FIGURE 2.2
Economic and political timeline of Qatar
/content/figure/9789927118951.b_9789927118951-ch02.b-9789927118951_002-fig2.3
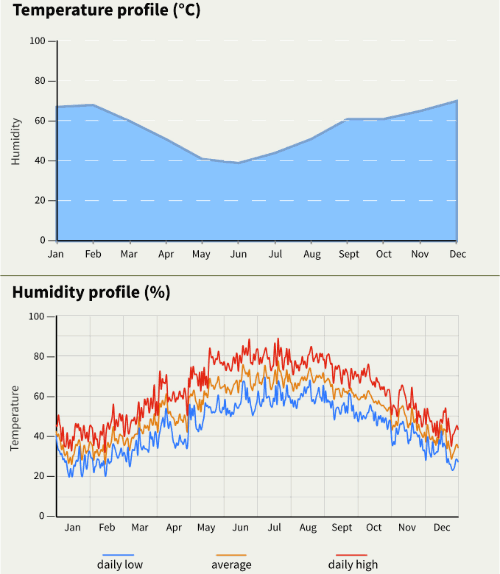
FIGURE 2.3
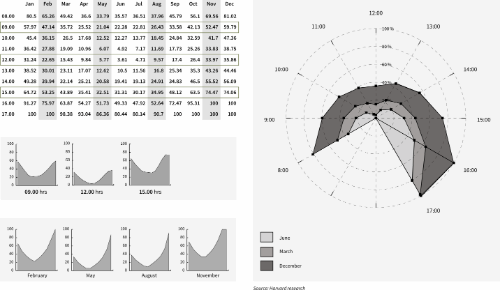
Temperature and humidity variation
9789927118951/b-9789927118951_002-fig3_thmb.gif
9789927118951/b-9789927118951_002-fig3.gif
FIGURE 2.3
Temperature and humidity variation
/content/figure/9789927118951.b_9789927118951-ch02.b-9789927118951_002-fig2.4
FIGURE 2.4
Outdoor dry bulb temperature
Each column represents one day, each cell represents one hour
9789927118951/b-9789927118951_002-fig4_thmb.gif
9789927118951/b-9789927118951_002-fig4.gif
FIGURE 2.4
Outdoor dry bulb temperature
Each column represents one day, each cell represents one hour
/content/figure/9789927118951.b_9789927118951-ch02.b-9789927118951_002-fig2.5
FIGURE 2.5
Annual heat index
9789927118951/b-9789927118951_002-fig5_thmb.gif
9789927118951/b-9789927118951_002-fig5.gif
FIGURE 2.5
Annual heat index
/content/figure/9789927118951.b_9789927118951-ch02.b-9789927118951_002-fig2.6
FIGURE 2.6
Annual temperature profile
9789927118951/b-9789927118951_002-fig6_thmb.gif
9789927118951/b-9789927118951_002-fig6.gif
FIGURE 2.6
Annual temperature profile
/content/figure/9789927118951.b_9789927118951-ch02.b-9789927118951_002-fig2.7
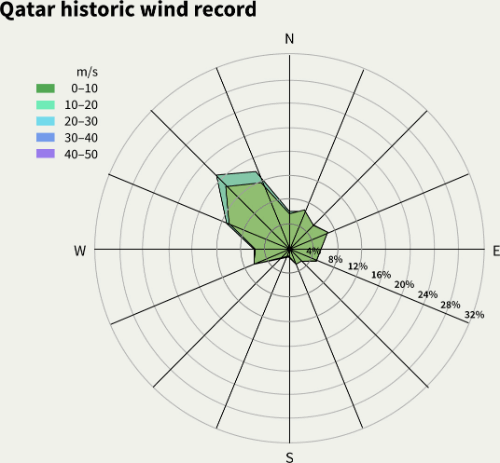
FIGURE 2.7
Wind variations
9789927118951/b-9789927118951_002-fig7_thmb.gif
9789927118951/b-9789927118951_002-fig7.gif
FIGURE 2.7
Wind variations
/content/figure/9789927118951.b_9789927118951-ch02.b-9789927118951_002-img2.1
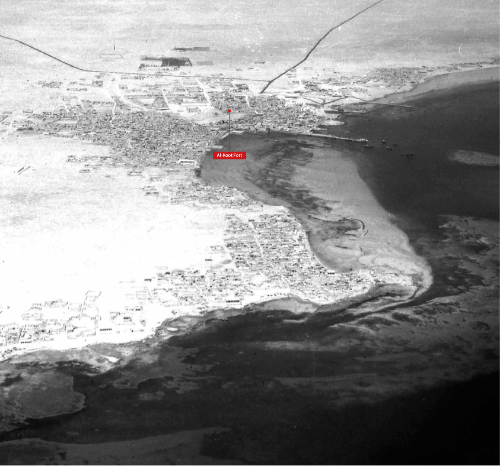
IMAGE 2.1
Aerial photograph of Doha, 1952
9789927118951/b-9789927118951_002-img1_thmb.gif
9789927118951/b-9789927118951_002-img1.gif
IMAGE 2.1
Aerial photograph of Doha, 1952
/content/figure/9789927118951.b_9789927118951-ch02.b-9789927118951_002-fig2.8
FIGURE 2.8
Timeline Qatar
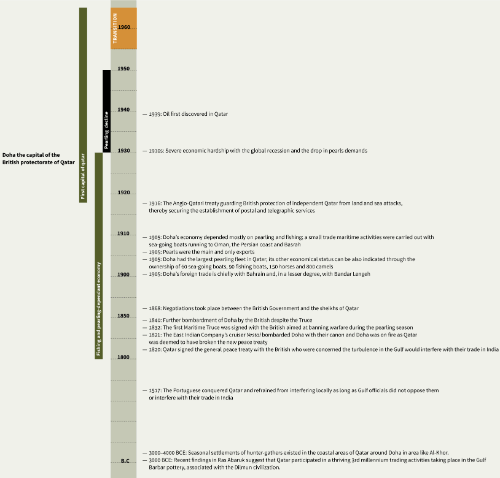
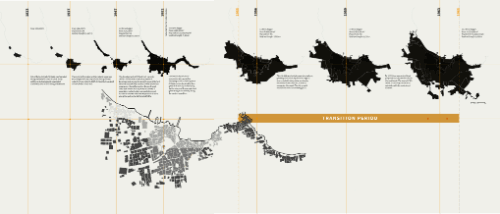
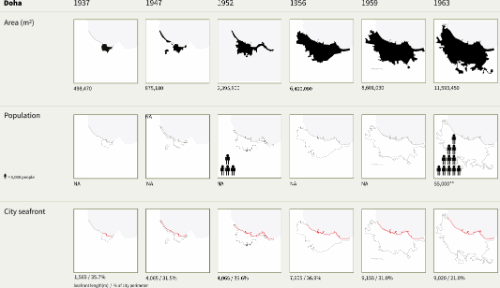
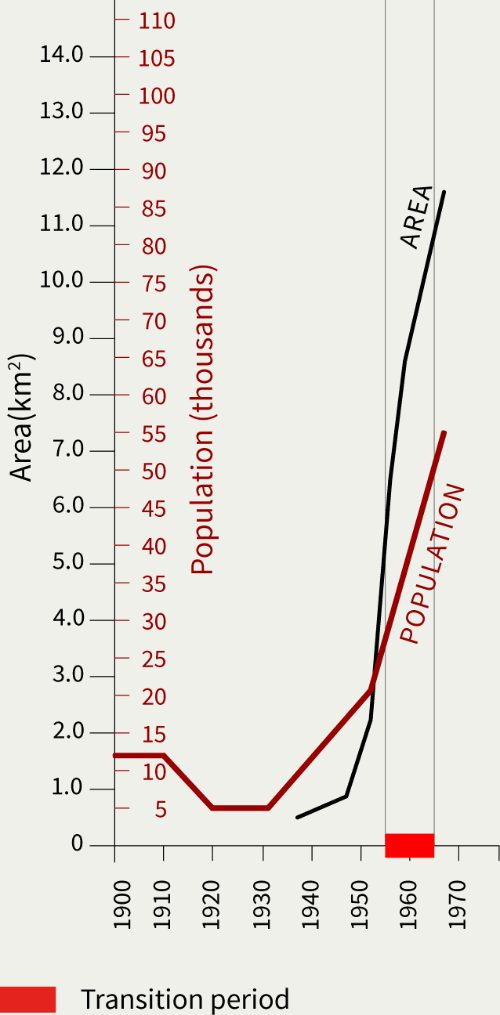
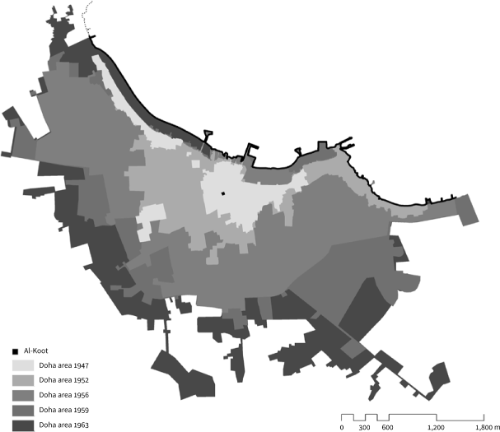
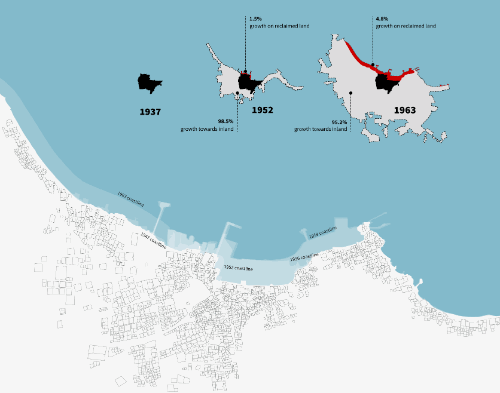
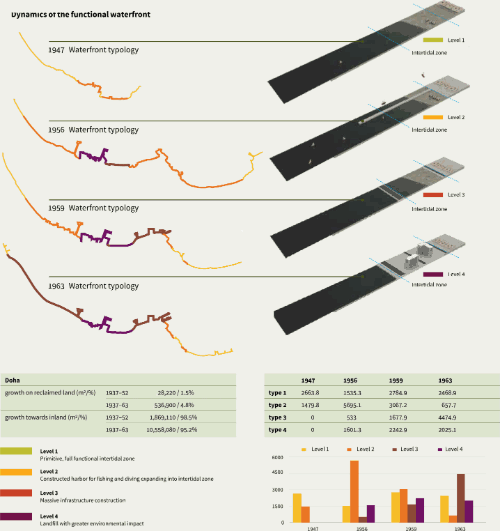
Following the first oil export in 1949, Doha entered a period of rapid growth in the 1950s. The first major land reclamation activities that would dramatically alter the coastline took place from 1952 to 1956. In 1952, the first official public school was opened, followed, in 1954, by public access to clean water. The Department of Public Health was established in the same year, and two dental clinics and three pharmacies were opened for the public. The first school for girls was opened in 1955 with 50 students enrolled. The first electricity grid and State hospital were both established in 1957; and in 1959, major arterial roads were built to connect the historic city with several new development areas and town centers, and the oil fields. Doha's population grew seven-fold from 1950 to 1960. However, it has to be noted that from the time oil was discovered in Doha, the subsequent urban growth and modernization took a decade to become fully manifest and start changing the city.
9789927118951/b-9789927118951_002-fig8_thmb.gif
9789927118951/b-9789927118951_002-fig8.gif
FIGURE 2.8
Timeline Qatar
Following the first oil export in 1949, Doha entered a period of rapid growth in the 1950s. The first major land reclamation activities that would dramatically alter the coastline took place from 1952 to 1956. In 1952, the first official public school was opened, followed, in 1954, by public access to clean water. The Department of Public Health was established in the same year, and two dental clinics and three pharmacies were opened for the public. The first school for girls was opened in 1955 with 50 students enrolled. The first electricity grid and State hospital were both established in 1957; and in 1959, major arterial roads were built to connect the historic city with several new development areas and town centers, and the oil fields. Doha's population grew seven-fold from 1950 to 1960. However, it has to be noted that from the time oil was discovered in Doha, the subsequent urban growth and modernization took a decade to become fully manifest and start changing the city.
/content/figure/9789927118951.b_9789927118951-ch02.b-9789927118951_002-unfig4
Untitled
9789927118951/b-9789927118951_002-unfig4_thmb.gif
9789927118951/b-9789927118951_002-unfig4.gif
/content/figure/9789927118951.b_9789927118951-ch02.b-9789927118951_002-fig2.9
FIGURE 2.9
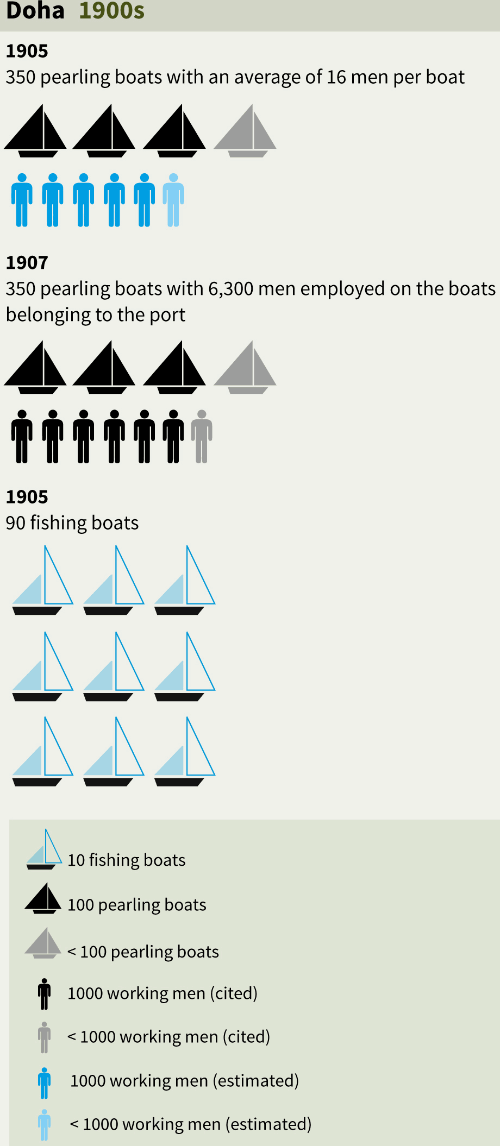
Doha pearling and fishing fleets
9789927118951/b-9789927118951_002-fig9_thmb.gif
9789927118951/b-9789927118951_002-fig9.gif
FIGURE 2.9
Doha pearling and fishing fleets
/content/figure/9789927118951.b_9789927118951-ch02.b-9789927118951_002-fig2.10
FIGURE 2.10
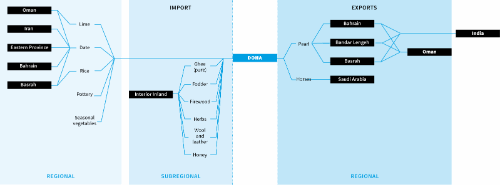
Doha regional and subregional imports and exports
9789927118951/b-9789927118951_002-fig10_thmb.gif
9789927118951/b-9789927118951_002-fig10.gif
FIGURE 2.10
Doha regional and subregional imports and exports
/content/figure/9789927118951.b_9789927118951-ch02.b-9789927118951_002-fig2.11
FIGURE 2.11
Trade network
9789927118951/b-9789927118951_002-fig11_thmb.gif
9789927118951/b-9789927118951_002-fig11.gif
FIGURE 2.11
Trade network
/content/figure/9789927118951.b_9789927118951-ch02.b-9789927118951_002-fig2.12
FIGURE 2.12
The pearling industry
9789927118951/b-9789927118951_002-fig12_thmb.gif
9789927118951/b-9789927118951_002-fig12.gif
FIGURE 2.12
The pearling industry
/content/figure/9789927118951.b_9789927118951-ch02.b-9789927118951_002-fig2.13
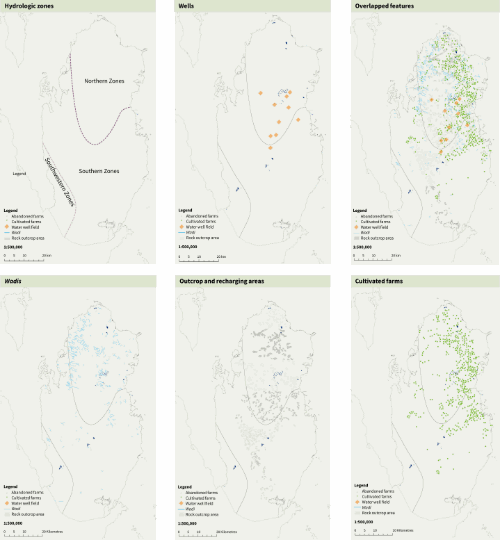
FIGURE 2.13
Hydrology and agriculture
9789927118951/b-9789927118951_002-fig13_thmb.gif
9789927118951/b-9789927118951_002-fig13.gif
FIGURE 2.13
Hydrology and agriculture
/content/figure/9789927118951.b_9789927118951-ch02.b-9789927118951_002-fig2.14
FIGURE 2.14
Topography profile
9789927118951/b-9789927118951_002-fig14_thmb.gif
9789927118951/b-9789927118951_002-fig14.gif
FIGURE 2.14
Topography profile
/content/figure/9789927118951.b_9789927118951-ch02.b-9789927118951_002-fig2.15
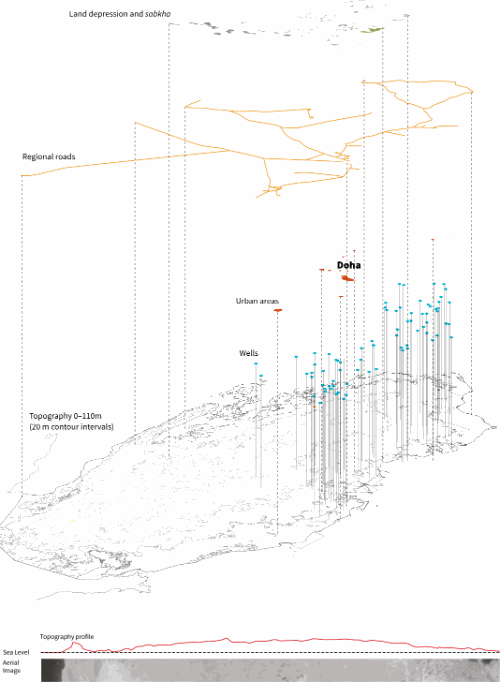
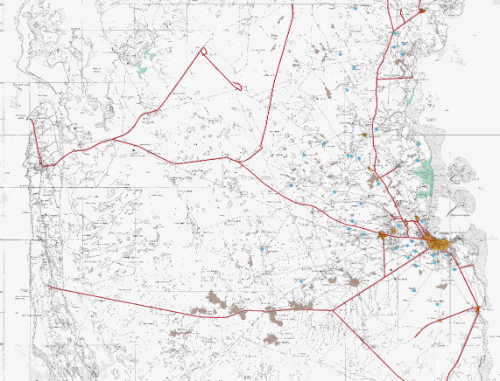
FIGURE 2.15
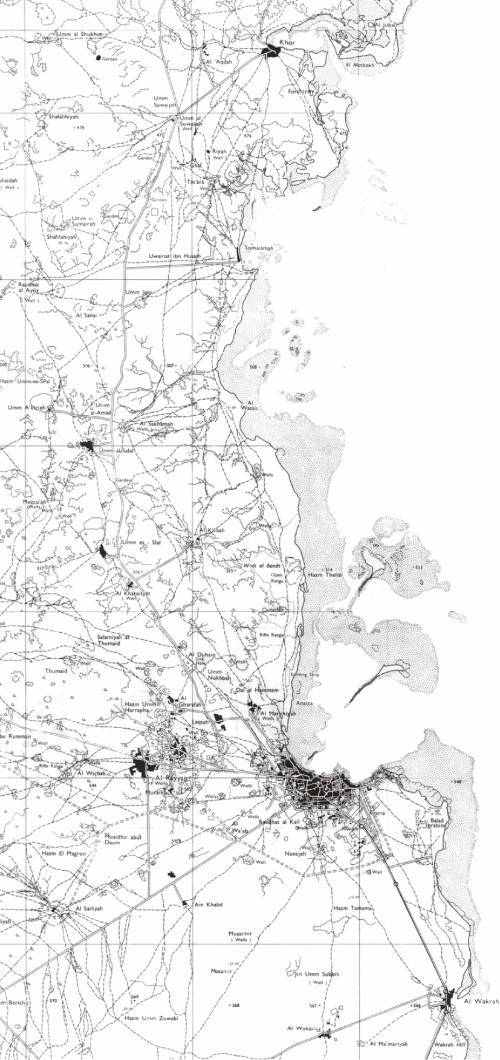
Map of Qatar, 1963
 Roads
Roads
 Wells
Wells
 Urban area
 Coastal sabkha
 Land depression
9789927118951/b-9789927118951_002-fig15_thmb.gif
9789927118951/b-9789927118951_002-fig15.gif
FIGURE 2.15
Map of Qatar, 1963
 Roads
Roads
 Wells
Wells
 Urban area
 Coastal sabkha
 Land depression
/content/figure/9789927118951.b_9789927118951-ch02.b-9789927118951_002-fig2.16
FIGURE 2.16
Subregional aquifers and recharge areas
9789927118951/b-9789927118951_002-fig16_thmb.gif
9789927118951/b-9789927118951_002-fig16.gif
FIGURE 2.16
Subregional aquifers and recharge areas
/content/figure/9789927118951.b_9789927118951-ch02.b-9789927118951_002-fig2.17
FIGURE 2.17
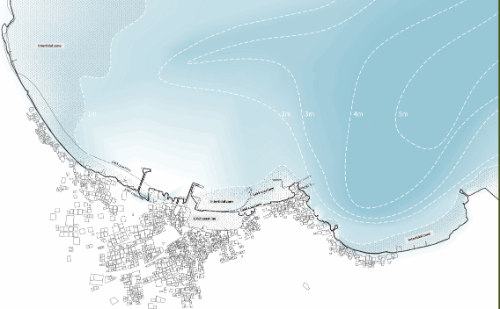
Water depths and the intertidal zone
9789927118951/b-9789927118951_002-fig17_thmb.gif
9789927118951/b-9789927118951_002-fig17.gif
FIGURE 2.17
Water depths and the intertidal zone
/content/figure/9789927118951.b_9789927118951-ch02.b-9789927118951_002-fig2.18
FIGURE 2.18
Map of Doha and surroundings, 1954
9789927118951/b-9789927118951_002-fig18_thmb.gif
9789927118951/b-9789927118951_002-fig18.gif
FIGURE 2.18
Map of Doha and surroundings, 1954
/content/figure/9789927118951.b_9789927118951-ch02.b-9789927118951_002-fig2.19
FIGURE 2.19
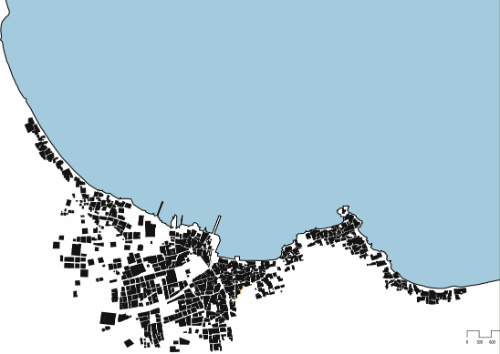
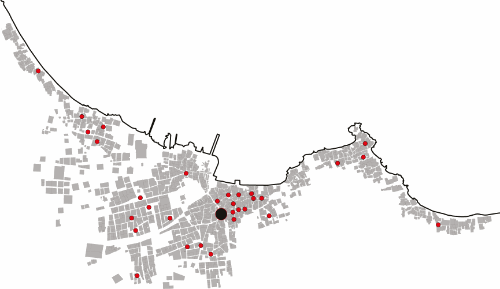
Urban parcels in Doha, 1952
9789927118951/b-9789927118951_002-fig19_thmb.gif
9789927118951/b-9789927118951_002-fig19.gif
FIGURE 2.19
Urban parcels in Doha, 1952
/content/figure/9789927118951.b_9789927118951-ch02.b-9789927118951_002-fig2.20
FIGURE 2.20
Evolution of the urban form
9789927118951/b-9789927118951_002-fig20_thmb.gif
9789927118951/b-9789927118951_002-fig20.gif
FIGURE 2.20
Evolution of the urban form
/content/figure/9789927118951.b_9789927118951-ch02.b-9789927118951_002-fig2.21
FIGURE 2.21
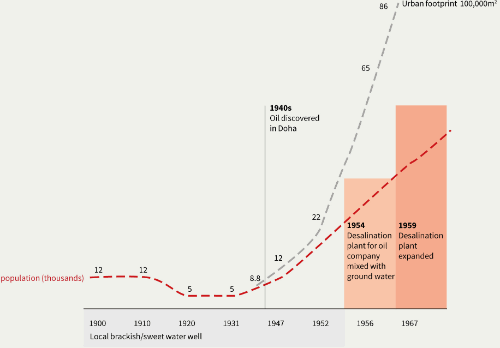
Area growth versus population growth
9789927118951/b-9789927118951_002-fig21_thmb.gif
9789927118951/b-9789927118951_002-fig21.gif
FIGURE 2.21
Area growth versus population growth
/content/figure/9789927118951.b_9789927118951-ch02.b-9789927118951_002-fig2.22
FIGURE 2.22
Area growth versus population growth
9789927118951/b-9789927118951_002-fig22_thmb.gif
9789927118951/b-9789927118951_002-fig22.gif
FIGURE 2.22
Area growth versus population growth
/content/figure/9789927118951.b_9789927118951-ch02.b-9789927118951_002-fig2.23
FIGURE 2.23
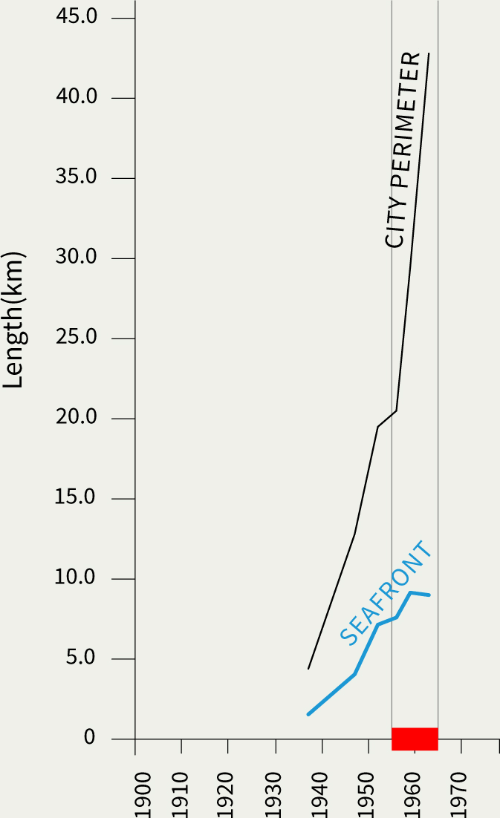
Seafront versus city perimeter
9789927118951/b-9789927118951_002-fig23_thmb.gif
9789927118951/b-9789927118951_002-fig23.gif
FIGURE 2.23
Seafront versus city perimeter
/content/figure/9789927118951.b_9789927118951-ch02.b-9789927118951_002-fig2.24
FIGURE 2.24
Doha city evolution index
9789927118951/b-9789927118951_002-fig24_thmb.gif
9789927118951/b-9789927118951_002-fig24.gif
FIGURE 2.24
Doha city evolution index
/content/figure/9789927118951.b_9789927118951-ch02.b-9789927118951_002-fig2.25
FIGURE 2.25
Doha land reclamation
9789927118951/b-9789927118951_002-fig25_thmb.gif
9789927118951/b-9789927118951_002-fig25.gif
FIGURE 2.25
Doha land reclamation
/content/figure/9789927118951.b_9789927118951-ch02.b-9789927118951_002-fig2.26
FIGURE 2.26
Dynamics of the functional waterfront
9789927118951/b-9789927118951_002-fig26_thmb.gif
9789927118951/b-9789927118951_002-fig26.gif
FIGURE 2.26
Dynamics of the functional waterfront
/content/figure/9789927118951.b_9789927118951-ch02.b-9789927118951_002-img2.2
IMAGE 2.2
Aerial photograph 56 aph of Doha, 1947
9789927118951/b-9789927118951_002-img2_thmb.gif
9789927118951/b-9789927118951_002-img2.gif
IMAGE 2.2
Aerial photograph 56 aph of Doha, 1947
/content/figure/9789927118951.b_9789927118951-ch02.b-9789927118951_002-fig2.27
FIGURE 2.27
Natural landform
9789927118951/b-9789927118951_002-fig27_thmb.gif
9789927118951/b-9789927118951_002-fig27.gif
FIGURE 2.27
Natural landform
/content/figure/9789927118951.b_9789927118951-ch02.b-9789927118951_002-fig2.28
FIGURE 2.28
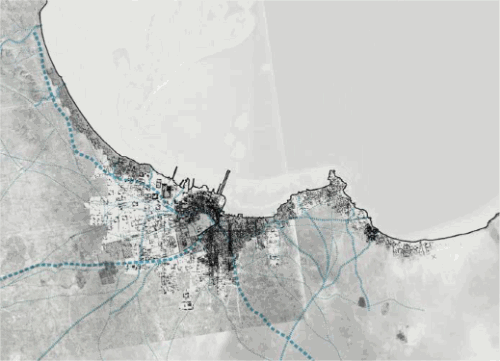
Wadis and discharge areas of Doha Bay
9789927118951/b-9789927118951_002-fig28_thmb.gif
9789927118951/b-9789927118951_002-fig28.gif
FIGURE 2.28
Wadis and discharge areas of Doha Bay
/content/figure/9789927118951.b_9789927118951-ch02.b-9789927118951_002-fig2.29
FIGURE 2.29
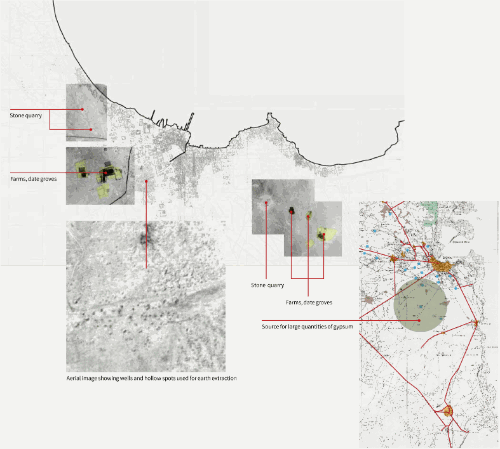
Building materials
9789927118951/b-9789927118951_002-fig29_thmb.gif
9789927118951/b-9789927118951_002-fig29.gif
FIGURE 2.29
Building materials
/content/figure/9789927118951.b_9789927118951-ch02.b-9789927118951_002-fig2.30
FIGURE 2.30
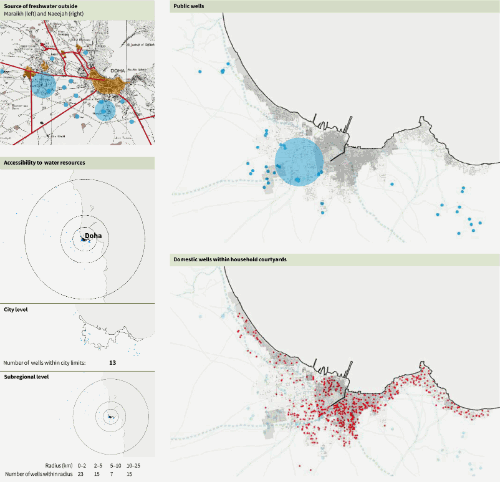
Water resource
9789927118951/b-9789927118951_002-fig30_thmb.gif
9789927118951/b-9789927118951_002-fig30.gif
FIGURE 2.30
Water resource
/content/figure/9789927118951.b_9789927118951-ch02.b-9789927118951_002-fig2.31
FIGURE 2.31
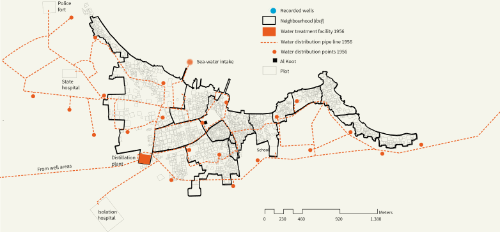
Water distribution points and pipelines, 1956
9789927118951/b-9789927118951_002-fig31_thmb.gif
9789927118951/b-9789927118951_002-fig31.gif
FIGURE 2.31
Water distribution points and pipelines, 1956
/content/figure/9789927118951.b_9789927118951-ch02.b-9789927118951_002-fig2.32
FIGURE 2.32
Urban footprint
9789927118951/b-9789927118951_002-fig32_thmb.gif
9789927118951/b-9789927118951_002-fig32.gif
FIGURE 2.32
Urban footprint
/content/figure/9789927118951.b_9789927118951-ch02.b-9789927118951_002-fig2.33
FIGURE 2.33
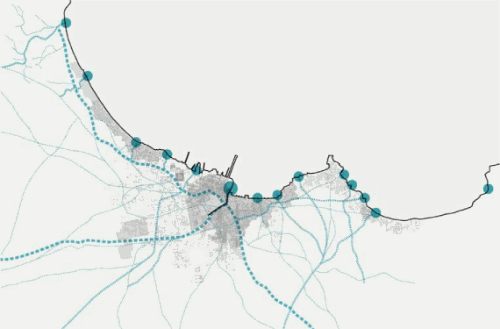
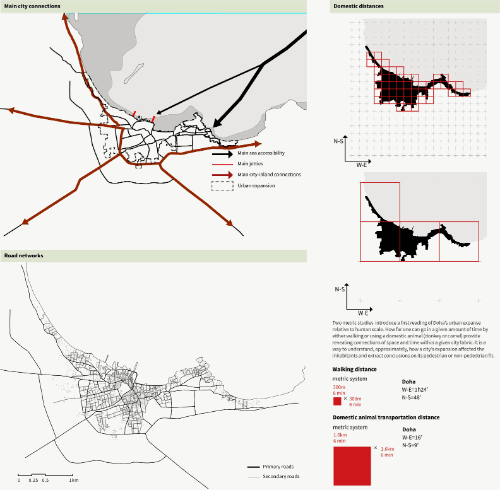
Sea and land accessibilities
9789927118951/b-9789927118951_002-fig33_thmb.gif
9789927118951/b-9789927118951_002-fig33.gif
FIGURE 2.33
Sea and land accessibilities
/content/figure/9789927118951.b_9789927118951-ch02.b-9789927118951_002-fig2.34
FIGURE 2.34
City neighbourhoods
9789927118951/b-9789927118951_002-fig34_thmb.gif
9789927118951/b-9789927118951_002-fig34.gif
FIGURE 2.34
City neighbourhoods
/content/figure/9789927118951.b_9789927118951-ch02.b-9789927118951_002-fig2.35
FIGURE 2.35
Barahas Jufairat
9789927118951/b-9789927118951_002-fig35_thmb.gif
9789927118951/b-9789927118951_002-fig35.gif
FIGURE 2.35
Barahas Jufairat
/content/figure/9789927118951.b_9789927118951-ch02.b-9789927118951_002-fig2.36
FIGURE 2.36
Urban components
9789927118951/b-9789927118951_002-fig36_thmb.gif
9789927118951/b-9789927118951_002-fig36.gif
FIGURE 2.36
Urban components
/content/figure/9789927118951.b_9789927118951-ch02.b-9789927118951_002-fig2.36a
Untitled
9789927118951/b-9789927118951_002-fig36a_thmb.gif
9789927118951/b-9789927118951_002-fig36a.gif
/content/figure/9789927118951.b_9789927118951-ch02.b-9789927118951_002-fig2.37
FIGURE 2.37
Neighbourhood subdivision analysis
9789927118951/b-9789927118951_002-fig37_thmb.gif
9789927118951/b-9789927118951_002-fig37.gif
FIGURE 2.37
Neighbourhood subdivision analysis
/content/figure/9789927118951.b_9789927118951-ch02.b-9789927118951_002-fig2.37a
Untitled
9789927118951/b-9789927118951_002-fig37a_thmb.gif
9789927118951/b-9789927118951_002-fig37a.gif
/content/figure/9789927118951.b_9789927118951-ch02.b-9789927118951_002-fig2.38
FIGURE 2.38
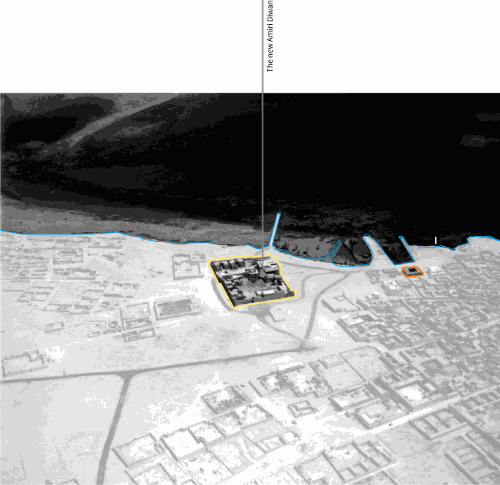
Aerial image of Doha souq and surroundings, 1952
9789927118951/b-9789927118951_002-fig38_thmb.gif
9789927118951/b-9789927118951_002-fig38.gif
FIGURE 2.38
Aerial image of Doha souq and surroundings, 1952
/content/figure/9789927118951.b_9789927118951-ch02.b-9789927118951_002-fig38a
Untitled
9789927118951/b-9789927118951_002-fig38a_thmb.gif
9789927118951/b-9789927118951_002-fig38a.gif
/content/figure/9789927118951.b_9789927118951-ch02.b-9789927118951_002-fig2.39
FIGURE 2.39
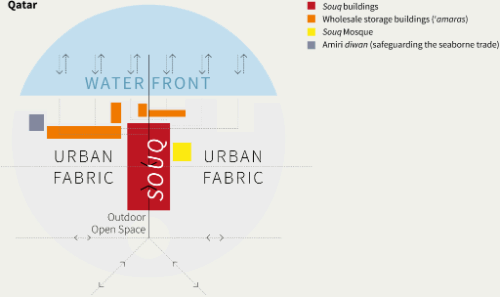
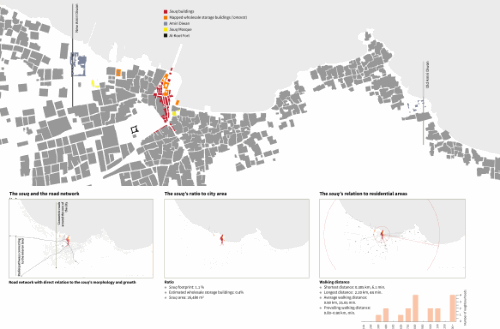
The souq’s relation to the city
9789927118951/b-9789927118951_002-fig39_thmb.gif
9789927118951/b-9789927118951_002-fig39.gif
FIGURE 2.39
The souq’s relation to the city
/content/figure/9789927118951.b_9789927118951-ch02.b-9789927118951_002-fig2.40
FIGURE 2.40
Configuration study
9789927118951/b-9789927118951_002-fig40_thmb.gif
9789927118951/b-9789927118951_002-fig40.gif
FIGURE 2.40
Configuration study
/content/figure/9789927118951.b_9789927118951-ch02.b-9789927118951_002-fig2.41
FIGURE 2.41
Aerial images of Doha, 1952
9789927118951/b-9789927118951_002-fig41_thmb.gif
9789927118951/b-9789927118951_002-fig41.gif
FIGURE 2.41
Aerial images of Doha, 1952
/content/figure/9789927118951.b_9789927118951-ch02.b-9789927118951_002-fig2.41a
Untitled
9789927118951/b-9789927118951_002-fig41a_thmb.gif
9789927118951/b-9789927118951_002-fig41a.gif
/content/figure/9789927118951.b_9789927118951-ch02.b-9789927118951_002-fig2.42
FIGURE 2.42
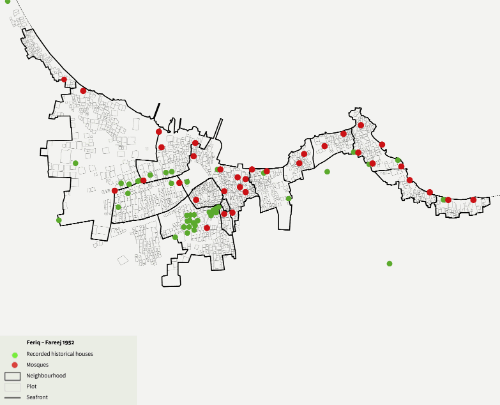
Map of Doha, 1952
9789927118951/b-9789927118951_002-fig42_thmb.gif
9789927118951/b-9789927118951_002-fig42.gif
FIGURE 2.42
Map of Doha, 1952
/content/figure/9789927118951.b_9789927118951-ch02.b-9789927118951_002-fig2.43
FIGURE 2.43
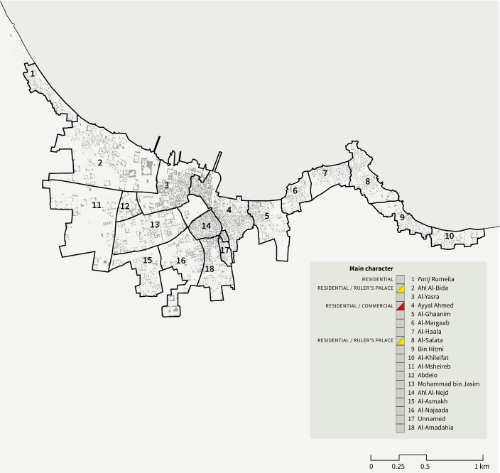
Doha neighbourhoods, 1952
9789927118951/b-9789927118951_002-fig43_thmb.gif
9789927118951/b-9789927118951_002-fig43.gif
FIGURE 2.43
Doha neighbourhoods, 1952
/content/figure/9789927118951.b_9789927118951-ch02.b-9789927118951_002-fig2.44
FIGURE 2.44
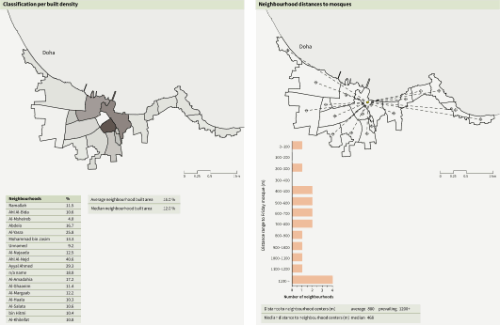
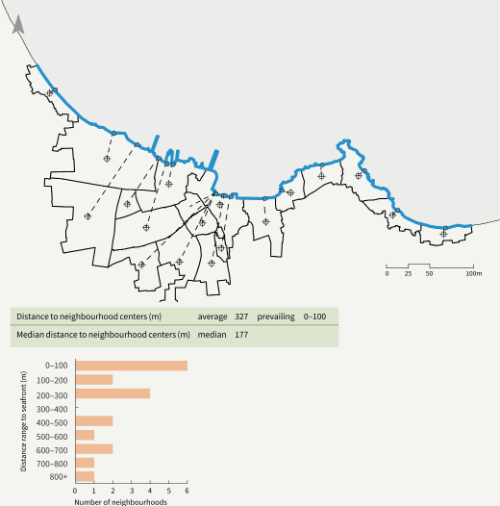
Neighbourhood distances to seafront
9789927118951/b-9789927118951_002-fig44_thmb.gif
9789927118951/b-9789927118951_002-fig44.gif
FIGURE 2.44
Neighbourhood distances to seafront
/content/figure/9789927118951.b_9789927118951-ch02.b-9789927118951_002-fig2.45
FIGURE 2.45
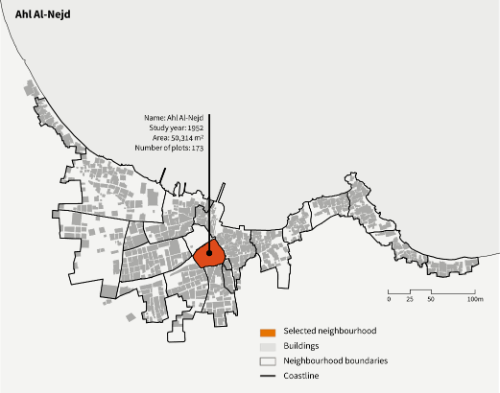
Selected neighbourhood
9789927118951/b-9789927118951_002-fig45_thmb.gif
9789927118951/b-9789927118951_002-fig45.gif
FIGURE 2.45
Selected neighbourhood
/content/figure/9789927118951.b_9789927118951-ch02.b-9789927118951_002-fig2.46
FIGURE 2.46
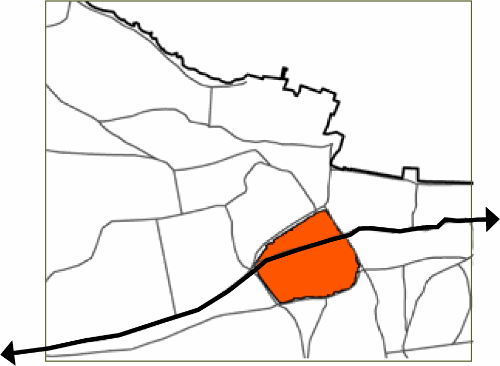
Main road through Ahl Al-Nejd
9789927118951/b-9789927118951_002-fig46_thmb.gif
9789927118951/b-9789927118951_002-fig46.gif
FIGURE 2.46
Main road through Ahl Al-Nejd
/content/figure/9789927118951.b_9789927118951-ch02.b-9789927118951_002-fig2.47
FIGURE 2.47
Aerial photograph of Ahl Al-Nejd, 1952
9789927118951/b-9789927118951_002-fig47_thmb.gif
9789927118951/b-9789927118951_002-fig47.gif
FIGURE 2.47
Aerial photograph of Ahl Al-Nejd, 1952
/content/figure/9789927118951.b_9789927118951-ch02.b-9789927118951_002-fig2.48
FIGURE 2.48
Network orientation and structure
9789927118951/b-9789927118951_002-fig48_thmb.gif
9789927118951/b-9789927118951_002-fig48.gif
FIGURE 2.48
Network orientation and structure
/content/figure/9789927118951.b_9789927118951-ch02.b-9789927118951_002-fig2.49
FIGURE 2.49
Land use
9789927118951/b-9789927118951_002-fig49_thmb.gif
9789927118951/b-9789927118951_002-fig49.gif
FIGURE 2.49
Land use
/content/figure/9789927118951.b_9789927118951-ch02.b-9789927118951_002-fig2.50
FIGURE 2.50
Figure ground
9789927118951/b-9789927118951_002-fig50_thmb.gif
9789927118951/b-9789927118951_002-fig50.gif
FIGURE 2.50
Figure ground
/content/figure/9789927118951.b_9789927118951-ch02.b-9789927118951_002-fig2.51
FIGURE 2.51
Aerial photograph, 1952
9789927118951/b-9789927118951_002-fig51_thmb.gif
9789927118951/b-9789927118951_002-fig51.gif
FIGURE 2.51
Aerial photograph, 1952
/content/figure/9789927118951.b_9789927118951-ch02.b-9789927118951_002-fig2.52
FIGURE 2.52
Neighbourhood analysis: Ahl Al-Nejd
9789927118951/b-9789927118951_002-fig52_thmb.gif
9789927118951/b-9789927118951_002-fig52.gif
FIGURE 2.52
Neighbourhood analysis: Ahl Al-Nejd
/content/figure/9789927118951.b_9789927118951-ch02.b-9789927118951_002-fig2.52a
Untitled
9789927118951/b-9789927118951_002-fig52a_thmb.gif
9789927118951/b-9789927118951_002-fig52a.gif
/content/figure/9789927118951.b_9789927118951-ch02.b-9789927118951_002-fig2.53
FIGURE 2.53
Neighbourhood analysis: Ahl Al-Nejd
9789927118951/b-9789927118951_002-fig53_thmb.gif
9789927118951/b-9789927118951_002-fig53.gif
FIGURE 2.53
Neighbourhood analysis: Ahl Al-Nejd
/content/figure/9789927118951.b_9789927118951-ch02.b-9789927118951_002-fig2.53a
Untitled
9789927118951/b-9789927118951_002-fig53a_thmb.gif
9789927118951/b-9789927118951_002-fig53a.gif
/content/figure/9789927118951.b_9789927118951-ch02.b-9789927118951_002-fig2.54
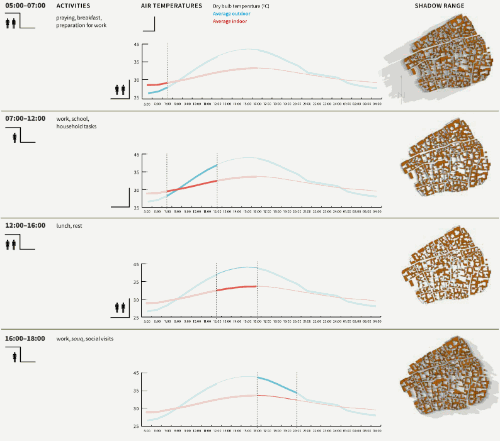
FIGURE 2.54
Typical schedule of a day on June 30
9789927118951/b-9789927118951_002-fig54_thmb.gif
9789927118951/b-9789927118951_002-fig54.gif
FIGURE 2.54
Typical schedule of a day on June 30
/content/figure/9789927118951.b_9789927118951-ch02.b-9789927118951_002-fig2.55
FIGURE 2.55
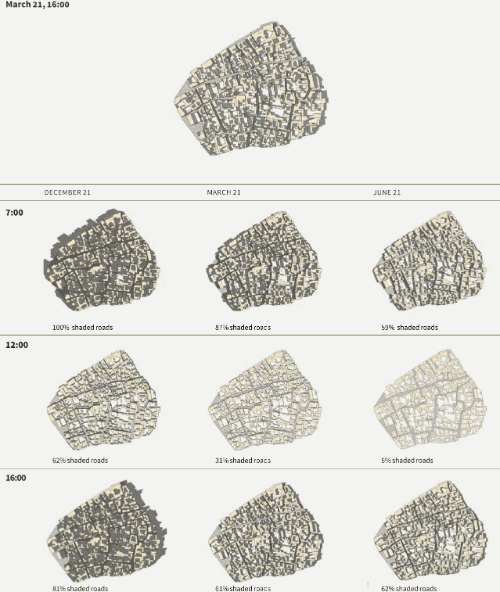
Shading layer
9789927118951/b-9789927118951_002-fig55_thmb.gif
9789927118951/b-9789927118951_002-fig55.gif
FIGURE 2.55
Shading layer
/content/figure/9789927118951.b_9789927118951-ch02.b-9789927118951_002-fig2.56
FIGURE 2.56
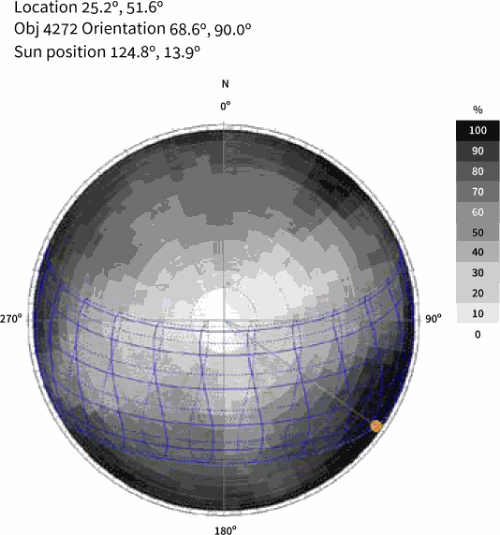
Spherical projection
9789927118951/b-9789927118951_002-fig56_thmb.gif
9789927118951/b-9789927118951_002-fig56.gif
FIGURE 2.56
Spherical projection
/content/figure/9789927118951.b_9789927118951-ch02.b-9789927118951_002-fig2.57
FIGURE 2.57
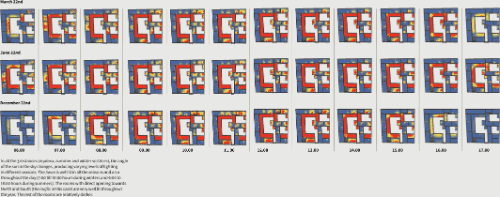
Shading simulation: selected times and days in the year
9789927118951/b-9789927118951_002-fig57_thmb.gif
9789927118951/b-9789927118951_002-fig57.gif
FIGURE 2.57
Shading simulation: selected times and days in the year
/content/figure/9789927118951.b_9789927118951-ch02.b-9789927118951_002-fig2.58
FIGURE 2.58
Identification and documentation of units
9789927118951/b-9789927118951_002-fig58_thmb.gif
9789927118951/b-9789927118951_002-fig58.gif
FIGURE 2.58
Identification and documentation of units
/content/figure/9789927118951.b_9789927118951-ch02.b-9789927118951_002-fig2.59
FIGURE 2.59
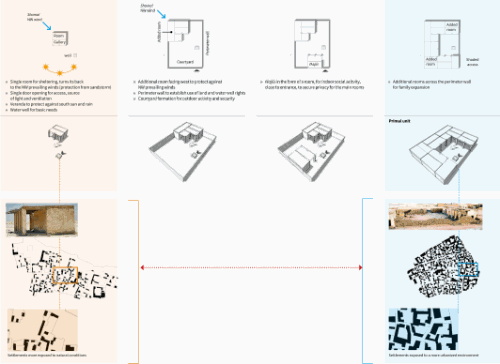
Evolution of the unit
9789927118951/b-9789927118951_002-fig59_thmb.gif
9789927118951/b-9789927118951_002-fig59.gif
FIGURE 2.59
Evolution of the unit
/content/figure/9789927118951.b_9789927118951-ch02.b-9789927118951_002-unfig5
Untitled
9789927118951/b-9789927118951_002-unfig5_thmb.gif
9789927118951/b-9789927118951_002-unfig5.gif
/content/figure/9789927118951.b_9789927118951-ch02.b-9789927118951_002-fig2.60
FIGURE 2.60
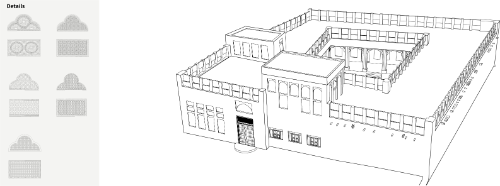
Plan and elevations
9789927118951/b-9789927118951_002-fig60_thmb.gif
9789927118951/b-9789927118951_002-fig60.gif
FIGURE 2.60
Plan and elevations
/content/figure/9789927118951.b_9789927118951-ch02.b-9789927118951_002-unfig6
Untitled
9789927118951/b-9789927118951_002-unfig6_thmb.gif
9789927118951/b-9789927118951_002-unfig6.gif
/content/figure/9789927118951.b_9789927118951-ch02.b-9789927118951_002-fig2.61
FIGURE 2.61
Plan and elevations
9789927118951/b-9789927118951_002-fig61_thmb.gif
9789927118951/b-9789927118951_002-fig61.gif
FIGURE 2.61
Plan and elevations
/content/figure/9789927118951.b_9789927118951-ch02.b-9789927118951_002-unfig6a
Untitled
9789927118951/b-9789927118951_002-unfig6a_thmb.gif
9789927118951/b-9789927118951_002-unfig6a.gif
/content/figure/9789927118951.b_9789927118951-ch02.b-9789927118951_002-fig2.62
FIGURE 2.62
Plan and elevations
9789927118951/b-9789927118951_002-fig62_thmb.gif
9789927118951/b-9789927118951_002-fig62.gif
FIGURE 2.62
Plan and elevations
/content/figure/9789927118951.b_9789927118951-ch02.b-9789927118951_002-unfig6b
Untitled
9789927118951/b-9789927118951_002-unfig6b_thmb.gif
9789927118951/b-9789927118951_002-unfig6b.gif
/content/figure/9789927118951.b_9789927118951-ch02.b-9789927118951_002-fig2.63
FIGURE 2.63
Plan and elevations
9789927118951/b-9789927118951_002-fig63_thmb.gif
9789927118951/b-9789927118951_002-fig63.gif
FIGURE 2.63
Plan and elevations
/content/figure/9789927118951.b_9789927118951-ch02.b-9789927118951_002-unfig7
Untitled
9789927118951/b-9789927118951_002-unfig7_thmb.gif
9789927118951/b-9789927118951_002-unfig7.gif
/content/figure/9789927118951.b_9789927118951-ch02.b-9789927118951_002-unfig7a
Untitled
9789927118951/b-9789927118951_002-unfig7a_thmb.gif
9789927118951/b-9789927118951_002-unfig7a.gif
/content/figure/9789927118951.b_9789927118951-ch02.b-9789927118951_002-fig2.64
FIGURE 2.64
Plan and elevations
9789927118951/b-9789927118951_002-fig64_thmb.gif
9789927118951/b-9789927118951_002-fig64.gif
FIGURE 2.64
Plan and elevations
/content/figure/9789927118951.b_9789927118951-ch02.b-9789927118951_002-unfig8
Untitled
9789927118951/b-9789927118951_002-unfig8_thmb.gif
9789927118951/b-9789927118951_002-unfig8.gif
/content/figure/9789927118951.b_9789927118951-ch02.b-9789927118951_002-fig2.65
FIGURE 2.65
Plan and elevations
9789927118951/b-9789927118951_002-fig65_thmb.gif
9789927118951/b-9789927118951_002-fig65.gif
FIGURE 2.65
Plan and elevations
/content/figure/9789927118951.b_9789927118951-ch02.b-9789927118951_002-unfig8a
Untitled
9789927118951/b-9789927118951_002-unfig8a_thmb.gif
9789927118951/b-9789927118951_002-unfig8a.gif
/content/figure/9789927118951.b_9789927118951-ch02.b-9789927118951_002-fig2.66
FIGURE 2.66
Plan and elevations
9789927118951/b-9789927118951_002-fig66_thmb.gif
9789927118951/b-9789927118951_002-fig66.gif
FIGURE 2.66
Plan and elevations
/content/figure/9789927118951.b_9789927118951-ch02.b-9789927118951_002-fig2.67
FIGURE 2.67
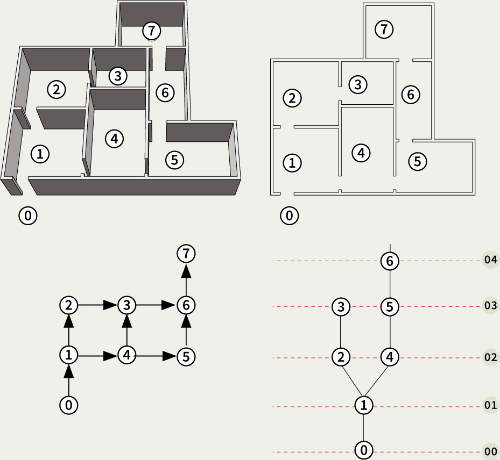
Configuration analysis
9789927118951/b-9789927118951_002-fig67_thmb.gif
9789927118951/b-9789927118951_002-fig67.gif
FIGURE 2.67
Configuration analysis
/content/figure/9789927118951.b_9789927118951-ch02.b-9789927118951_002-unfig9
Untitled
9789927118951/b-9789927118951_002-unfig9_thmb.gif
9789927118951/b-9789927118951_002-unfig9.gif
/content/figure/9789927118951.b_9789927118951-ch02.b-9789927118951_002-fig2.68
FIGURE 2.68
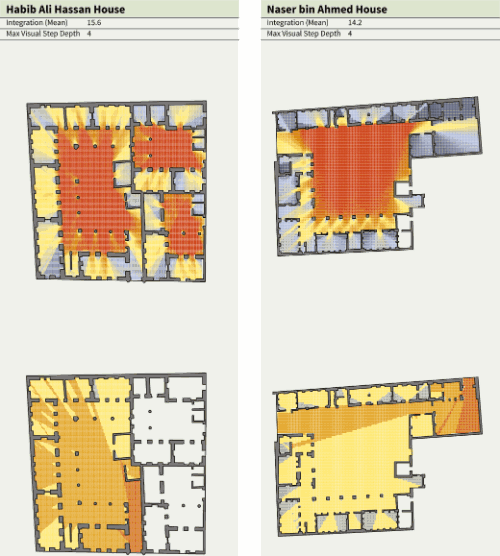
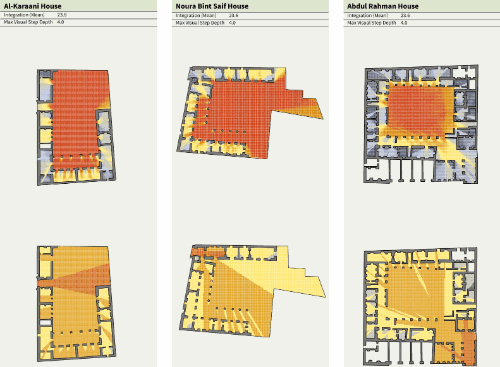
Visibility Graph Analysis
9789927118951/b-9789927118951_002-fig68_thmb.gif
9789927118951/b-9789927118951_002-fig68.gif
FIGURE 2.68
Visibility Graph Analysis
/content/figure/9789927118951.b_9789927118951-ch02.b-9789927118951_002-unfig10
Untitled
9789927118951/b-9789927118951_002-unfig10_thmb.gif
9789927118951/b-9789927118951_002-unfig10.gif
/content/figure/9789927118951.b_9789927118951-ch02.b-9789927118951_002-unfig11
Untitled
9789927118951/b-9789927118951_002-unfig11_thmb.gif
9789927118951/b-9789927118951_002-unfig11.gif
/content/figure/9789927118951.b_9789927118951-ch02.b-9789927118951_002-unfig11a
Untitled
9789927118951/b-9789927118951_002-unfig11a_thmb.gif
9789927118951/b-9789927118951_002-unfig11a.gif
/content/figure/9789927118951.b_9789927118951-ch02.b-9789927118951_002-fig2.69
FIGURE 2.69
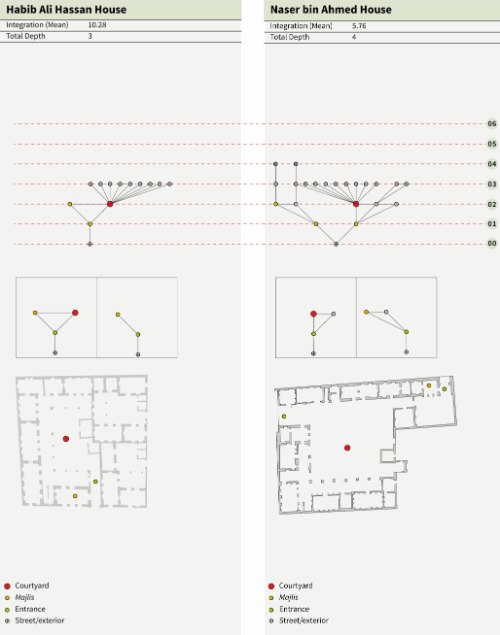
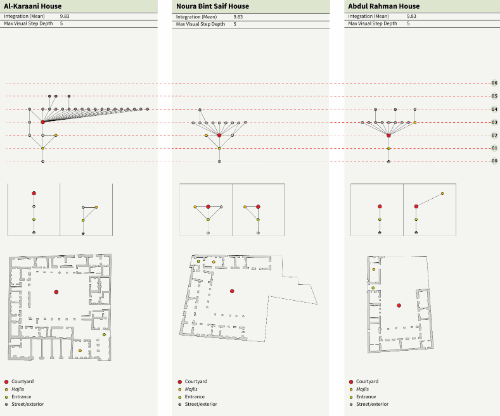
Justified Permeability Graphs
9789927118951/b-9789927118951_002-fig69_thmb.gif
9789927118951/b-9789927118951_002-fig69.gif
FIGURE 2.69
Justified Permeability Graphs
/content/figure/9789927118951.b_9789927118951-ch02.b-9789927118951_002-unfig12
Untitled
9789927118951/b-9789927118951_002-unfig12_thmb.gif
9789927118951/b-9789927118951_002-unfig12.gif
/content/figure/9789927118951.b_9789927118951-ch02.b-9789927118951_002-unfig13
Untitled
9789927118951/b-9789927118951_002-unfig13_thmb.gif
9789927118951/b-9789927118951_002-unfig13.gif
/content/figure/9789927118951.b_9789927118951-ch02.b-9789927118951_002-fig2.70
FIGURE 2.70
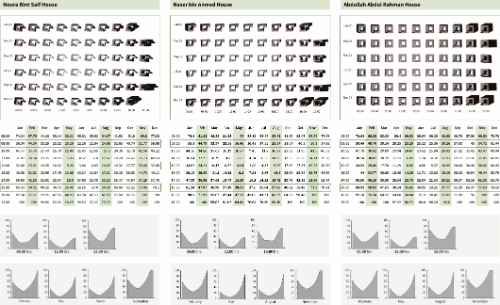
Shading Analysis
9789927118951/b-9789927118951_002-fig70_thmb.gif
9789927118951/b-9789927118951_002-fig70.gif
FIGURE 2.70
Shading Analysis
/content/figure/9789927118951.b_9789927118951-ch02.b-9789927118951_002-unfig13a
Untitled
9789927118951/b-9789927118951_002-unfig13a_thmb.gif
9789927118951/b-9789927118951_002-unfig13a.gif
/content/figure/9789927118951.b_9789927118951-ch02.b-9789927118951_002-unfig13b
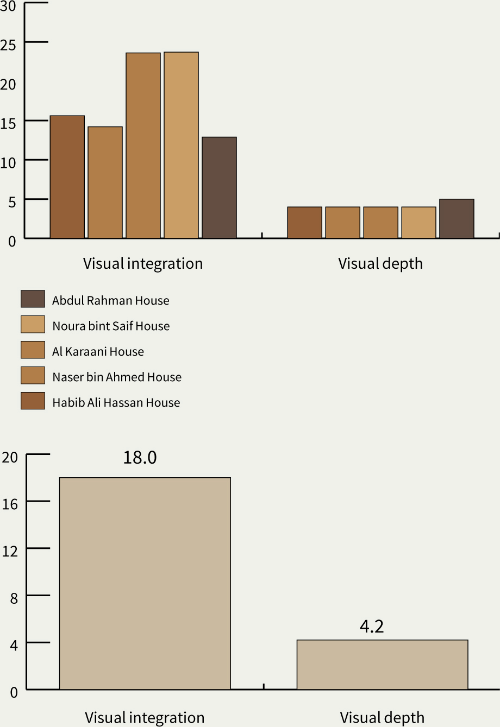
Untitled
9789927118951/b-9789927118951_002-unfig13b_thmb.gif
9789927118951/b-9789927118951_002-unfig13b.gif
/content/figure/9789927118951.b_9789927118951-ch02.b-9789927118951_002-fig2.71
FIGURE 2.71
Shaded area of courtyards
9789927118951/b-9789927118951_002-fig71_thmb.gif
9789927118951/b-9789927118951_002-fig71.gif
FIGURE 2.71
Shaded area of courtyards
/content/figure/9789927118951.b_9789927118951-ch02.b-9789927118951_002-fig2.72
FIGURE 2.72
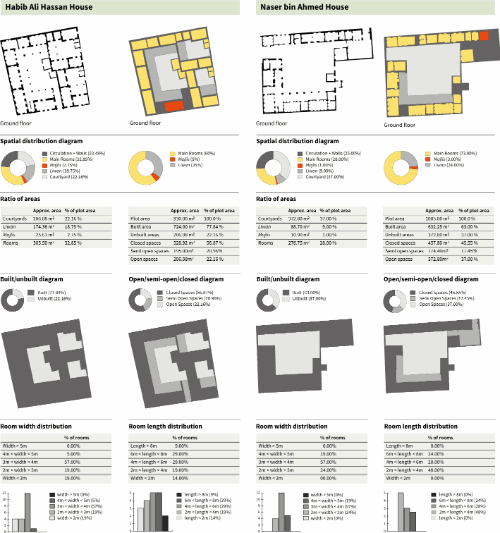
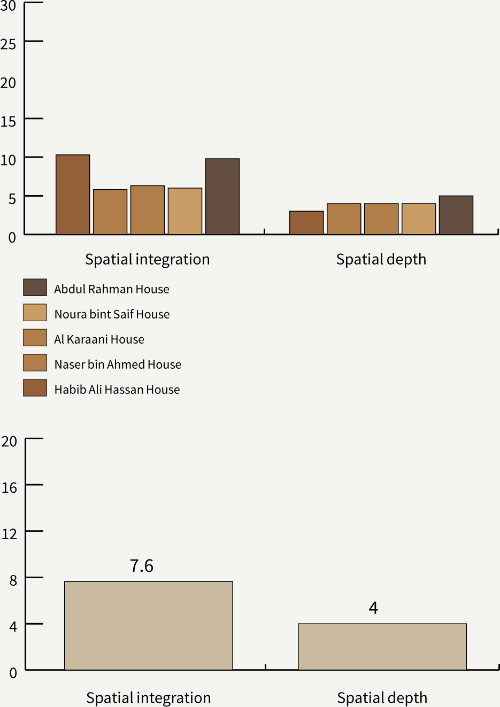
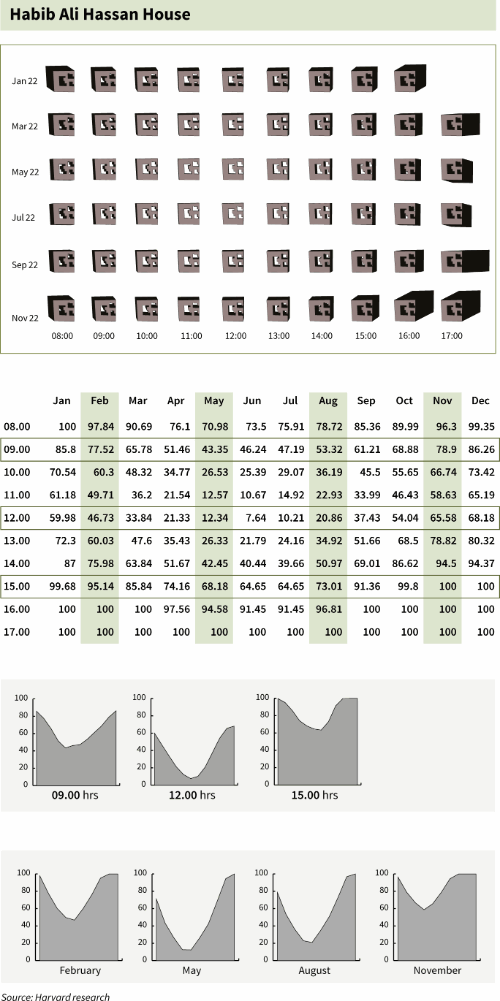
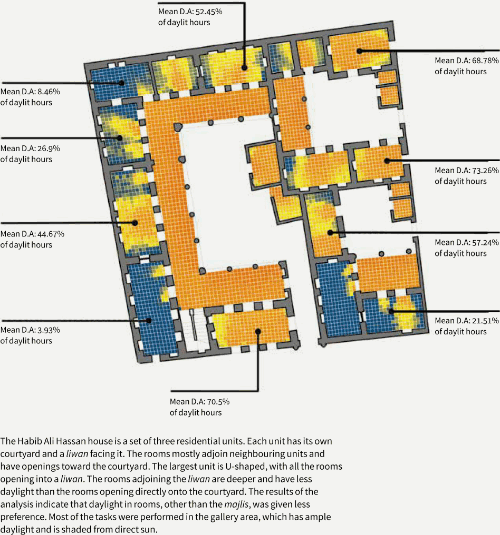
Habib Ali Hassan House
9789927118951/b-9789927118951_002-fig72_thmb.gif
9789927118951/b-9789927118951_002-fig72.gif
FIGURE 2.72
Habib Ali Hassan House
/content/figure/9789927118951.b_9789927118951-ch02.b-9789927118951_002-fig2.73
FIGURE 2.73
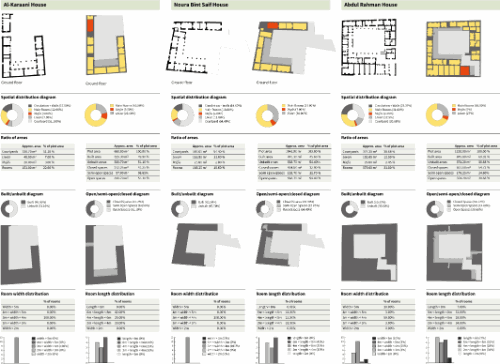
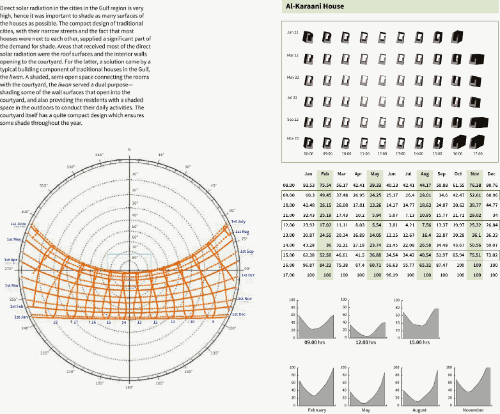
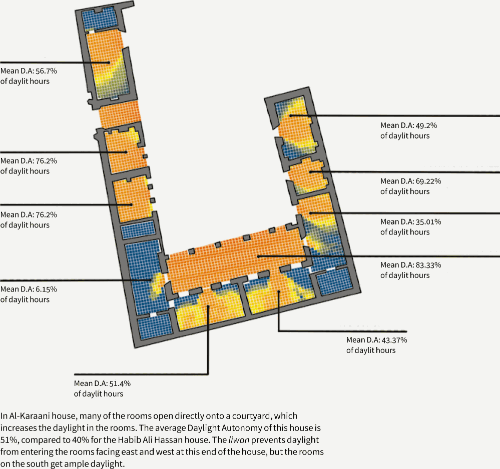
Al-Karaani House
9789927118951/b-9789927118951_002-fig73_thmb.gif
9789927118951/b-9789927118951_002-fig73.gif
FIGURE 2.73
Al-Karaani House
/content/figure/9789927118951.b_9789927118951-ch02.b-9789927118951_002-fig2.74
FIGURE 2.74
Habib Ali Hassan House
9789927118951/b-9789927118951_002-fig74_thmb.gif
9789927118951/b-9789927118951_002-fig74.gif
FIGURE 2.74
Habib Ali Hassan House
/content/figure/9789927118951.b_9789927118951-ch02.b-9789927118951_002-fig2.75
FIGURE 2.75
Unit thermal analysis
9789927118951/b-9789927118951_002-fig75_thmb.gif
9789927118951/b-9789927118951_002-fig75.gif
FIGURE 2.75
Unit thermal analysis
/content/figure/9789927118951.b_9789927118951-ch02.b-9789927118951_002-fig2.76
FIGURE 2.76
Free running building
9789927118951/b-9789927118951_002-fig76_thmb.gif
9789927118951/b-9789927118951_002-fig76.gif
FIGURE 2.76
Free running building
/content/figure/9789927118951.b_9789927118951-ch02.b-9789927118951_002-fig2.76a
Untitled
9789927118951/b-9789927118951_002-fig76a_thmb.gif
9789927118951/b-9789927118951_002-fig76a.gif
/content/figure/9789927118951.b_9789927118951-ch02.b-9789927118951_002-fig2.77
FIGURE 2.77
Heating and cooling loads
9789927118951/b-9789927118951_002-fig77_thmb.gif
9789927118951/b-9789927118951_002-fig77.gif
FIGURE 2.77
Heating and cooling loads
/content/figure/9789927118951.b_9789927118951-ch02.b-9789927118951_002-fig2.78
FIGURE 2.78
Thermal environment
9789927118951/b-9789927118951_002-fig78_thmb.gif
9789927118951/b-9789927118951_002-fig78.gif
FIGURE 2.78
Thermal environment
/content/figure/9789927118951.b_9789927118951-ch02.b-9789927118951_002-fig2.79
FIGURE 2.79
Floor area ratios
9789927118951/b-9789927118951_002-fig79_thmb.gif
9789927118951/b-9789927118951_002-fig79.gif
FIGURE 2.79
Floor area ratios
/content/figure/9789927118951.b_9789927118951-ch02.b-9789927118951_002-fig2.79a
Untitled
9789927118951/b-9789927118951_002-fig79a_thmb.gif
9789927118951/b-9789927118951_002-fig79a.gif
Tables
Table 1
The pearling industry
-
From This Site
/content/chapter/9789927118951.b_9789927118951-ch02dcterms_subject,pub_keyword-contentType:Journal105
/content/chapter/9789927118951.b_9789927118951-ch02
dcterms_subject,pub_keyword
-contentType:Journal
10
5
Chapter
content/book/9789927118951
Book
true
en


